
Compare Britannia Inds. with Similar Stocks
Total Returns (Price + Dividend) 
Latest dividend: 75.13246753246753 per share ex-dividend date: Aug-04-2025
Risk Adjusted Returns v/s
Returns Beta

News

Britannia Industries Ltd is Rated Sell
Britannia Industries Ltd is rated 'Sell' by MarketsMOJO, with this rating last updated on 13 April 2026. However, the analysis and financial metrics discussed here reflect the stock's current position as of 19 June 2026, providing investors with an up-to-date perspective on the company’s fundamentals, returns, and market standing.
Read full news article
Britannia Industries Ltd is Rated Sell
Britannia Industries Ltd is rated 'Sell' by MarketsMOJO, with this rating last updated on 13 April 2026. However, the analysis and financial metrics discussed here reflect the stock's current position as of 08 June 2026, providing investors with the latest insights into its performance and outlook.
Read full news article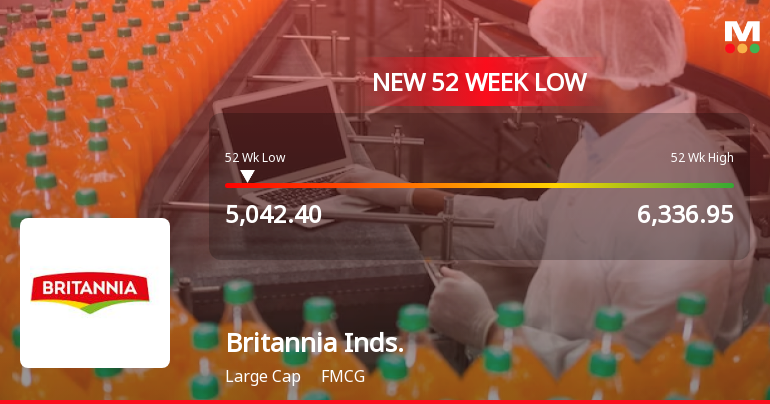
Britannia Industries Ltd Falls to 52-Week Low of Rs 5038 as Sell-Off Deepens
For the sixth consecutive session, Britannia Industries Ltd has closed lower, slipping to a fresh 52-week low of Rs 5038 on 4 Jun 2026. This marks a cumulative decline of 5.47% over the past six days, underscoring persistent selling pressure despite the broader market's tepid performance.
Read full news article Announcements
Announcement under Regulation 30 (LODR)-Newspaper Publication
14-Jun-2026 | Source : BSENewspaper Advertisement regarding the transfer of Equity Shares of the Company to the demat account of IEPF Authority.
Announcement under Regulation 30 (LODR)-Change in Management
11-Jun-2026 | Source : BSEPursuant to Regulation 30 read with Clause 7 of Para A of Part A of Schedule III of the SEBI Listing Regulations 2015 this is to inform you that Mr. Manjunath Desai Vice President - Consumer Insight Media and Competitive Intelligence has submitted his resignation to pursue an external opportunity.
Announcement under Regulation 30 (LODR)-Analyst / Investor Meet - Intimation
08-Jun-2026 | Source : BSEPursuant to Regulation 30 read with Clause 15 of Para A of Part A of Schedule III of the SEBI Listing Regulations 2015 this is to inform you that a one-to-one meet with an Institutional Investor is scheduled on Friday 12th June 2026 at 11:00 A.M. IST at the Executive Office of the Company situated at Prestige Shantiniketan the Business Precinct Tower C 17th Floor Whitefield Main Road Mahadevapura Post Bengaluru - 560 048 Karnataka India.
Corporate Actions

No Upcoming Board Meetings

Britannia Industries Ltd has declared 9050% dividend, ex-date: 31 Jul 26

Britannia Industries Ltd has announced 1:2 stock split, ex-date: 29 Nov 18

Britannia Industries Ltd has announced 1:1 bonus issue, ex-date: 25 May 21

No Rights history available
Quality key factors
Valuation key factors
Technicals key factors
 Technical Indicator Scale: Bearish, Mildly Bearish, Sideways, Mildly Bullish, Bullish Turned
 Shareholding Snapshot : Mar 2026
Shareholding Compare (%holding)
Promoters
None
Held by 43 Schemes (10.39%)
Held by 861 FIIs (15.63%)
Associated Biscuits International Limited (44.76%)
Lici New Pension Plus Secured Fund (2.99%)
12.18%
Quarterly Results Snapshot (Consolidated) - Mar'26 - QoQ

QoQ Growth in quarter ended Mar 2026 is -5.05% vs 2.67% in Dec 2025
QoQ Growth in quarter ended Mar 2026 is -0.24% vs 3.89% in Dec 2025
Half Yearly Results Snapshot (Consolidated) - Sep'25

Growth in half year ended Sep 2025 is 6.11% vs 5.62% in Sep 2024
Growth in half year ended Sep 2025 is 13.32% vs -0.77% in Sep 2024
Nine Monthly Results Snapshot (Consolidated) - Dec'25
YoY Growth in nine months ended Dec 2025 is 6.83% vs 6.38% in Dec 2024
YoY Growth in nine months ended Dec 2025 is 14.60% vs 1.08% in Dec 2024
Annual Results Snapshot (Consolidated) - Mar'26
YoY Growth in year ended Mar 2026 is 6.74% vs 7.00% in Mar 2025
YoY Growth in year ended Mar 2026 is 16.28% vs 1.82% in Mar 2025
About Britannia Industries Ltd

Company Coordinates


