
Compare Camlin Fine with Similar Stocks
Dashboard
Weak Long Term Fundamental Strength with a -30.80% CAGR growth in Operating Profits over the last 5 years
- Low ability to service debt as the company has a high Debt to EBITDA ratio of 7.60 times
- The company has been able to generate a Return on Equity (avg) of 4.73% signifying low profitability per unit of shareholders funds
Negative results in Mar 26
Falling Participation by Institutional Investors
Below par performance in long term as well as near term
Stock DNA
Specialty Chemicals
INR 2,593 Cr (Small Cap)
NA (Loss Making)
41
0.00%
0.54
-0.69%
2.31
Total Returns (Price + Dividend) 
Latest dividend: 0.44999999999999996 per share ex-dividend date: Jul-28-2016
Risk Adjusted Returns v/s
Returns Beta

News
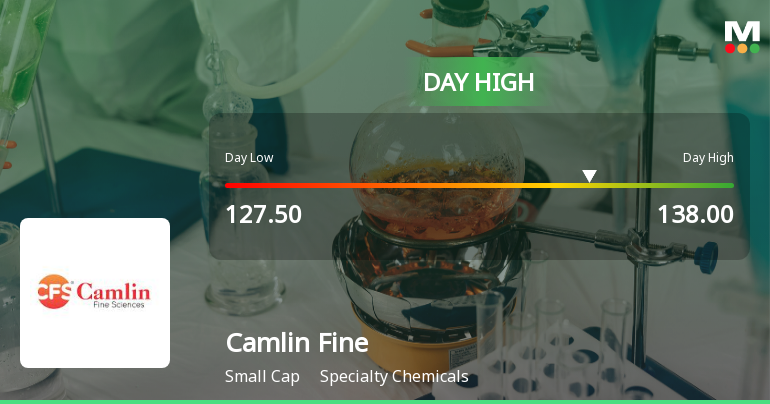
Camlin Fine Sciences Ltd Surges 7.7% to Day's High of Rs 135.15 — Outperforms Sector by 5.51 Percentage Points
The Sensex gained 1.09% on 12 Jun 2026, yet Camlin Fine Sciences Ltd outpaced the market with a 7.7% surge, reaching an intraday high of Rs 135.15. This 5.51 percentage-point outperformance over the Specialty Chemicals sector highlights a distinctly stock-specific rally rather than a broad market lift.
Read full news article
Camlin Fine Sciences Ltd is Rated Strong Sell
Camlin Fine Sciences Ltd is rated Strong Sell by MarketsMOJO. This rating was last updated on 10 February 2026. However, the analysis and financial metrics discussed below reflect the company’s current position as of 08 June 2026, providing investors with the latest insights into its performance and outlook.
Read full news article
Camlin Fine Sciences Ltd is Rated Strong Sell
Camlin Fine Sciences Ltd is rated Strong Sell by MarketsMOJO. This rating was last updated on 10 February 2026, reflecting a shift from the previous 'Sell' grade. However, the analysis and financial metrics discussed below represent the stock's current position as of 08 June 2026, providing investors with an up-to-date view of the company’s fundamentals, returns, and market performance.
Read full news article Announcements
Announcement under Regulation 30 (LODR)-Earnings Call Transcript
29-May-2026 | Source : BSETranscript of the Investor Call dated May 26 2026
Compliances-Reg.24(A)-Annual Secretarial Compliance
28-May-2026 | Source : BSEAnnual Secretarial Compliance Report for the year ended March 31 2026.
Announcement under Regulation 30 (LODR)-Newspaper Publication
27-May-2026 | Source : BSENewspaper Publication - Audited Financial Results for the quarter and year ended 31.03.2026
Corporate Actions

No Upcoming Board Meetings

Camlin Fine Sciences Ltd has declared 45% dividend, ex-date: 28 Jul 16

Camlin Fine Sciences Ltd has announced 1:2 stock split, ex-date: 04 Sep 14

No Bonus history available

Camlin Fine Sciences Ltd has announced 5:41 rights issue, ex-date: 08 Jan 25
Quality key factors
Valuation key factors
Technicals key factors
 Technical Indicator Scale: Bearish, Mildly Bearish, Sideways, Mildly Bullish, Bullish Turned
 Shareholding Snapshot : Mar 2026
Shareholding Compare (%holding)
Promoters
16.5828
Held by 5 Schemes (6.8%)
Held by 42 FIIs (0.94%)
Ashish Subhash Dandekar (10.3%)
Icici Prudential Commodities Fund (4.8%)
28.28%
Quarterly Results Snapshot (Consolidated) - Mar'26 - YoY

YoY Growth in quarter ended Mar 2026 is -1.57% vs 14.58% in Mar 2025

YoY Growth in quarter ended Mar 2026 is 12,350.00% vs 99.07% in Mar 2025
Half Yearly Results Snapshot (Consolidated) - Sep'25
Growth in half year ended Sep 2025 is 10.68% vs -3.31% in Sep 2024
Growth in half year ended Sep 2025 is 81.86% vs -3,403.66% in Sep 2024
Nine Monthly Results Snapshot (Consolidated) - Dec'25
YoY Growth in nine months ended Dec 2025 is 7.70% vs 1.47% in Dec 2024
YoY Growth in nine months ended Dec 2025 is 56.21% vs -785.60% in Dec 2024
Annual Results Snapshot (Consolidated) - Mar'26
YoY Growth in year ended Mar 2026 is 5.81% vs 12.02% in Mar 2025
YoY Growth in year ended Mar 2026 is 119.87% vs -49.92% in Mar 2025
About Camlin Fine Sciences Ltd

Company Coordinates


