Cams Services

  • Market Cap: Small Cap
  • Industry: Capital Markets
  • ISIN: INE596I01020
  • NSEID: CAMS
  • BSEID: 543232
INR
752.90
-29.1 (-3.72%)
BSENSE

Sep 01, 03:20 PM

BSE+NSE Vol: 1.13 lacs

  • Price Points
  • Score
  • Mojo Parameters
  • Total Return
  • News and Corporate Actions
  • Key factors
  • Shareholding
  • Financials
  • CompanyCV
stock-summaryPrice Point
High/Low

1Day

52 Week

Valuation
Technical
Day's Volume

CASH

1.13 lacs (-94.03%) Volume

Shareholding (Jun 2026)

FII

44.88%

Held by 268 FIIs

DII

23.55%

Held by 53 DIIs

Promoter

0.00%

Why is Computer Age Management Services Ltd falling/rising?

01-Sep-2026

As of 31-Aug, the stock price of Computer Age Management Services Ltd is rising to 782.75, reflecting a 2.86% increase. This rise is driven by strong relative performance, consecutive gains, positive momentum above moving averages, increased investor participation, high management efficiency, and significant institutional holdings.

As of 31-Aug, the stock price of Computer Age Management Services Ltd is rising, currently at 782.75, reflecting an increase of 21.75 (2.86%). This upward movement can be attributed to several factors. <BR><BR>Firstly, the stock has outperformed the sector by 2.77% today, indicating strong relative performance. Additionally, it has experienced consecutive gains over the last two days, accumulating a total return of 5.49% during this period. The stock also reached an intraday high of Rs 786.1, which is a 3.3% increase, showcasing positive momentum.<BR><BR>Moreover, the stock is trading above its 5-day, 20-day, 50-day, 100-day, and 200-day moving averages, which is often a bullish signal for investors. The rising investor participation is another significant factor, with delivery volume on 28 August increasing by 441.85% compared to the 5-day average, indicating heightened interest and confidence among investors.<BR><BR>Furthermore, the company boasts high management efficiency, evidenced by a return on equity (ROE) of 39.51%, and it is net-debt free, which enhances its financial stability. High institutional holdings at 68.44%, which have increased by 1.93% over the previous quarter, suggest that knowledgeable investors are confident in the company's fundamentals, further supporting the stock's rise. <BR><BR>Overall, these factors contribute to the positive movement in the stock price of Computer Age Management Services Ltd.

View full answer

Who are in the management team of Cams Services?

01-Sep-2026

The management team of Cams Services includes Anuj Kumar (Managing Director), D K Mehrotra (Chairman & Independent Director), V Srinivasa Rangan, G Manikandan (Senior VP & Company Secretary), Natarajan Srinivasan, Vijayalakshmi R Iyer, Narendra Ostawal, and Sandeep Ramesh Kagzi, each contributing diverse expertise to the company.

The management team of Cams Services includes the following individuals:<BR><BR>1. **Anuj Kumar** - Managing Director<BR>2. **D K Mehrotra** - Chairman & Independent Director<BR>3. **V Srinivasa Rangan** - Nominee<BR>4. **G Manikandan** - Senior Vice President & Company Secretary<BR>5. **Natarajan Srinivasan** - Independent Director<BR>6. **Vijayalakshmi R Iyer** - Independent Director<BR>7. **Narendra Ostawal** - Nominee<BR>8. **Sandeep Ramesh Kagzi** - Nominee<BR><BR>This team brings a diverse range of expertise and leadership to the company.

View full answer

What does Cams Services do?

01-Sep-2026

Computer Age Management Services Limited (CAMS) is India's largest Mutual Fund Transfer Agency, with a market cap of INR 18,920 Cr and reported net sales of 395 Cr and net profit of 128 Cr for June 2026. Key metrics include a P/E ratio of 39.00 and a dividend yield of 1.68%.

Overview:<BR>Computer Age Management Services Limited (CAMS) is India's largest Mutual Fund Transfer Agency, operating within the Capital Markets industry and categorized as a Small Cap company.<BR><BR>History:<BR>CAMS was incorporated in an unspecified year and has established itself as a leading Transfer Agency in the Indian mutual fund industry. The latest quarterly results reported are for June 2026, showing significant sales and profit figures.<BR><BR>Financial Snapshot:<BR>Most recent Net Sales: 395 Cr (Quarterly Results - Jun 2026) <BR>Most recent Net Profit: 128 Cr (Quarterly Results - Jun 2026) <BR>Market-cap value: INR 18,920 Cr (Small Cap)<BR><BR>Key Metrics:<BR>P/E: 39.00 <BR>Industry P/E: 31 <BR>Dividend Yield: 1.68% <BR>Debt-Equity: -0.60 <BR>Return on Equity: 36.04% <BR>Price-to-Book: 14.30 <BR><BR>Contact Details:<BR>Registrar Address: Not available. <BR>Phone: Not available. <BR>Email: Not available. <BR>Website: Not available.

View full answer

Who are the peers of the Cams Services?

01-Sep-2026

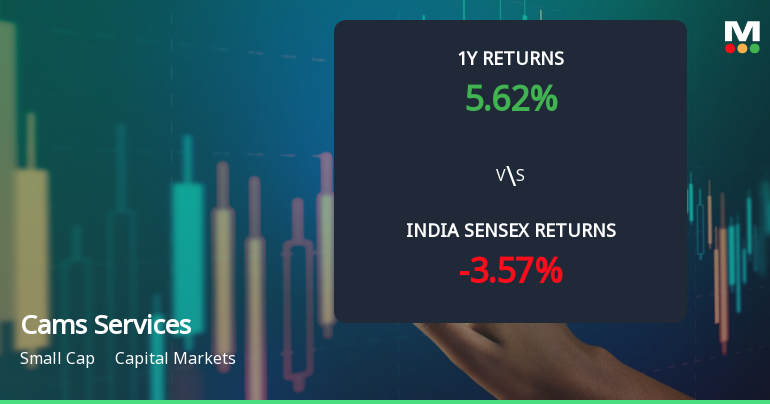
Cams Services' peers include CRISIL, Nuvama Wealth, Aditya AMC, Angel One, N S D L, KFin Technologies, Prudent Corp, UTI AMC, Indian Energy Exchange, and C D S L. Nuvama Wealth leads with a 1-year return of 37.21%, while Cams Services has a return of 5.62%, higher than N S D L's -34.39%.

Peers: The peers of Cams Services are CRISIL, Nuvama Wealth, Aditya AMC, Angel One, N S D L, KFin Technolog., Prudent Corp, UTI AMC, Indian Energy Ex, and C D S L.<BR><BR>Quality Snapshot: Excellent management risk is observed at CRISIL, Nuvama Wealth, Angel One, KFin Technolog., Prudent Corp, and C D S L, while Good management risk is found at Aditya AMC and UTI AMC. Average management risk is noted at N S D L. In terms of growth, Good growth is seen at Nuvama Wealth, Angel One, KFin Technolog., Aditya AMC, and Prudent Corp, while Below Average growth is observed at Cams Services, UTI AMC, and Indian Energy Ex. The rest have Average growth. Excellent capital structure is present across all peers.<BR><BR>Return Snapshot: The peer with the highest 1-year return is Nuvama Wealth at 37.21%, while the lowest is N S D L at -34.39%. Cams Services has a 1-year return of 5.62%, which is higher than N S D L but lower than Nuvama Wealth. Additionally, N S D L, UTI AMC, and Indian Energy Ex have negative six-month returns.

View full answer

How big is Cams Services?

01-Sep-2026

As of 31st August, Computer Age Management Services Ltd has a market capitalization of 18,920.00 Cr, with recent Net Sales of 1,557.13 Cr and a Net Profit of 494.93 Cr.

As of 31st August, Computer Age Management Services Ltd has a market capitalization of 18,920.00 Cr, categorizing it as a Small Cap company.<BR><BR>In the latest four quarters, the company reported Net Sales of 1,557.13 Cr and a Net Profit of 494.93 Cr.<BR><BR>The latest reporting period for the balance sheet is March 2026, with Shareholder's Funds amounting to 1,320.91 Cr and Total Assets of 1,789.87 Cr.

View full answer

Should I buy, sell or hold Computer Age Management Services Ltd?

25-Aug-2026

Are Computer Age Management Services Ltd latest results good or bad?

04-Aug-2026

Computer Age Management Services Ltd (CAMS) reported mixed results, with a slight net profit increase but flat revenue growth, raising concerns about future momentum. While margins remain strong, the stagnation in revenue may lead investors to be cautious about the company's growth prospects.

Computer Age Management Services Ltd (CAMS) has reported mixed results for the latest quarter. While the company demonstrated operational resilience, with consolidated net profit increasing by 1.26% quarter-on-quarter to ₹128.02 crores and a year-on-year growth of 17.35%, revenue remained virtually flat at ₹395.03 crores, reflecting a slight decline of 0.05% from the previous quarter.<BR><BR>The operating margin, although slightly lower at 46.26%, remains healthy and shows a significant improvement of 270 basis points year-on-year. The PAT margin also improved to 32.17%, indicating strong profitability. However, the stagnation in revenue growth raises concerns, especially given the company's premium valuation, trading at 42 times trailing earnings.<BR><BR>Overall, while CAMS maintains strong margins and profitability, the flat revenue growth signals challenges in sustaining momentum, particularly in a mature market phase. Investors may view these results as a sign of stability but might be cautious about the company's growth prospects moving forward.

View full answer

Has Computer Age Management Services Ltd declared dividend?

04-Aug-2026

Yes, Computer Age Management Services Ltd has declared a dividend of 125% (₹4 per share) with an ex-date of August 12, 2026. The company has shown positive total returns across various periods, particularly over the long term.

Computer Age Management Services Ltd has declared a dividend.<BR><BR>Dividend Details:<BR>- Percentage announced: 125%<BR>- Amount per share: 4<BR>- Ex-date: 12 Aug 26<BR><BR>Dividend Yield: 1.57%.<BR><BR>Total Returns by Period:<BR>In the last 3 months, the price return was 10.23%, the dividend return was 0.80%, resulting in a total return of 11.03%.<BR><BR>Over the past 6 months, the price return was 9.59%, the dividend return was 0.89%, leading to a total return of 10.48%.<BR><BR>For the 1-year period, the price return was 6.01%, the dividend return was 1.69%, which resulted in a total return of 7.7%.<BR><BR>In the 2-year period, the price return was -7.72%, the dividend return was 2.93%, culminating in a total return of -4.79%.<BR><BR>Over the last 3 years, the price return was 74.39%, the dividend return was 6.86%, giving a total return of 81.25%.<BR><BR>In the 4-year period, the price return was 64.66%, the dividend return was 8.89%, resulting in a total return of 73.55%.<BR><BR>For the 5-year period, the price return was 16.38%, the dividend return was 6.62%, leading to a total return of 23.0%.<BR><BR>Overall, Computer Age Management Services Ltd has declared a substantial dividend and demonstrated positive total returns across various periods, particularly over the longer term, indicating a strong performance in terms of both price and dividends.

View full answer

How has been the historical performance of Cams Services?

25-Nov-2025

Cams Services has shown consistent growth from March 2020 to March 2025, with net sales increasing from 699.63 Cr to 1,422.48 Cr and profit after tax rising from 171.89 Cr to 464.70 Cr, alongside significant improvements in operating profit and total assets. The company demonstrates strong financial performance with robust revenue, profit, and asset growth.

Answer:<BR>The historical performance of Cams Services shows a consistent growth trajectory in net sales and profitability over the years leading up to March 2025.<BR><BR>Breakdown:<BR>Cams Services has demonstrated significant growth in net sales, increasing from 699.63 Cr in March 2020 to 1,422.48 Cr in March 2025. This upward trend reflects a steady rise in total operating income, which also reached 1,422.48 Cr in March 2025, compared to 699.63 Cr in March 2020. The company's operating profit (PBDIT) has similarly improved, rising from 286.57 Cr in March 2020 to 704.86 Cr in March 2025, indicating a robust operational efficiency with an operating profit margin of 45.85% in the latest fiscal year. Profit before tax has increased from 246.84 Cr in March 2020 to 618.66 Cr in March 2025, while profit after tax has surged from 171.89 Cr to 464.70 Cr over the same period. The company's total assets have grown from 795.57 Cr in March 2020 to 1,579.72 Cr in March 2025, supported by an increase in shareholder's funds from 548.86 Cr to 1,118.55 Cr. Cash flow from operating activities has also improved, reaching 477.00 Cr in March 2025, reflecting strong cash generation capabilities. Overall, Cams Services has shown a solid financial performance with increasing revenues, profits, and asset growth over the years.

View full answer

Is Cams Services technically bullish or bearish?

24-Nov-2025

As of November 21, 2025, Cams Services shows a mildly bullish trend, supported by weekly and daily indicators, despite mixed signals from monthly metrics.

As of 21 November 2025, the technical trend for Cams Services has changed from bullish to mildly bullish. The current stance is mildly bullish, driven by several key indicators. The weekly MACD and KST are both mildly bullish, while the daily moving averages indicate a bullish trend. The monthly RSI shows a bullish signal, although the monthly MACD and Bollinger Bands are mildly bearish. Overall, the mixed signals across different time frames suggest a cautious bullish outlook, with strength primarily in the weekly and daily indicators.

View full answer

Who are the top shareholders of the Cams Services?

17-Jul-2025

The top shareholders of Cams Services include Foreign Institutional Investors (FIIs) with 55.0%, mutual funds with 10.69%, and individual investors holding 21.21%. The highest public shareholder is Ashish Parthasarthy with 3.15%, and there are no pledged promoter holdings.

The top shareholders of Cams Services include a significant presence of Foreign Institutional Investors (FIIs), who hold 55.0% of the company's shares. Additionally, mutual funds are represented by 32 schemes, accounting for 10.69% of the holdings. The highest public shareholder is Ashish Parthasarthy, associated with the HDB Employee Welfare Trust, holding 3.15%. Individual investors collectively own 21.21% of the shares. Notably, there are no pledged promoter holdings, and there is no single promoter with the highest holding.

View full answer

Is Cams Services overvalued or undervalued?

09-Jun-2025

As of January 12, 2021, Computer Age Management Services Ltd. is considered very expensive due to high valuation metrics, including a PE ratio of 44.81 and a PEG ratio of 1.39, despite short-term outperformance against the Sensex.

As of 12 January 2021, the valuation grade for Computer Age Management Services Ltd. moved from does not qualify to very expensive. The company appears to be overvalued based on its current financial metrics. The PE ratio stands at 44.81, while the EV to EBITDA ratio is 31.39, and the Price to Book Value is 18.84, all indicating a premium valuation compared to typical market standards.<BR><BR>In comparison to its peer, Computer Age Management Services Ltd. has a similar PE ratio of 44.81, which reinforces its classification as very expensive. The PEG ratio of 1.39 also suggests that growth expectations are already priced in at a high level. Notably, while the stock has outperformed the Sensex in the short term, with a 1-month return of 23.04% compared to the Sensex's 3.83%, the long-term performance shows a decline of 15.12% year-to-date, further supporting the notion that the stock may be overvalued.

View full answer

When is the next results date for Cams Services?

06-Jun-2025

No Upcoming Board Meetings

iScoreScore
Click here to find our call on this stock
Strong Sell
Sell
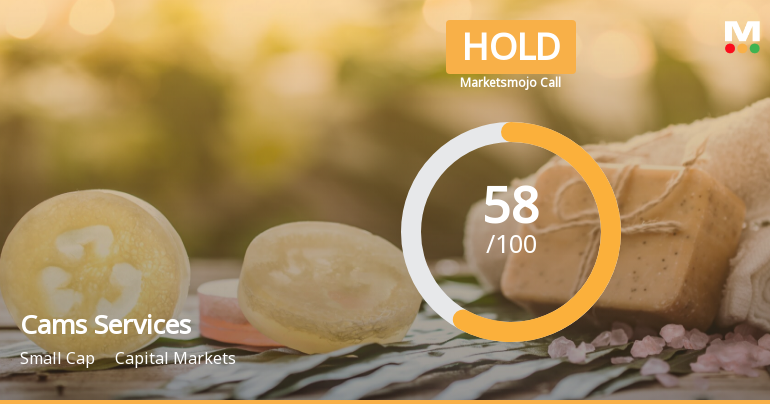
Hold
Buy
Strong Buy

Dashboard

1

High Management Efficiency with a high ROE of 39.51%

 
2

The company is Net-Debt Free

 
3

Poor long term growth as Operating profit has grown by an annual rate 15.65% of over the last 5 years

 
4

Flat results in Jun 26

5

With ROE of 36, it has a Very Expensive valuation with a 14.7 Price to Book Value

6

High Institutional Holdings at 68.44%

stock-summaryMojo Parameters

Mojo Parameters

Loading Valuation Snapshot...

Stock DNA

stock-summary
Industry

Capital Markets

stock-summary
Market cap

INR 18,703 Cr (Small Cap)

stock-summary
P/E

39.00

stock-summary
Industry P/E

31

stock-summary
Dividend Yield

1.63%

stock-summary
Debt Equity

-0.60

stock-summary
Return on Equity

36.04%

stock-summary
Price to Book

14.71

Revenue and Profits:
Net Sales:
395 Cr
(Quarterly Results - Jun 2026)
Net Profit:
128 Cr
stock-summaryTotal Returns
Total Returns (Price + Dividend) stock-summary
Dividend Yield (1.63%)
TimePeriod
Price Return
Dividend Return
Total Return
3 Months
-2.16%
0.86%
-1.3%
6 Months
11.11%
1.00%
12.11%
1 Year
-1.96%
1.66%
-0.3%
2 Years
-11.66%
2.79%
-8.87%
3 Years
59.78%
6.76%
66.54%
4 Years
64.37%
7.73%
72.1%
5 Years
-4.95%
7.29%
2.34%

Latest dividend: 2.5 per share ex-dividend date: Aug-12-2026

Risk Adjusted Returns v/s stock-summary
Returns Beta
Icon
Beta has not been calculated since enough price history is not available
stock-summaryNews & Corporate Actions

News

Announcements stock-summary

Icon
No announcement available

Corporate Actions stock-summary

stock-summary
BOARD MEETING

No Upcoming Board Meetings

stock-summary
DIVIDEND

Computer Age Management Services Ltd has declared 125% dividend, ex-date: 12 Aug 26

stock-summary
SPLITS

Computer Age Management Services Ltd has announced 2:10 stock split, ex-date: 05 Dec 25

stock-summary
BONUS

No Bonus history available

stock-summary
RIGHTS

No Rights history available

stock-summaryKey Factors

Quality key factors stock-summary

Factor
Value
Sales Growth (5y)
15.49%
EBIT Growth (5y)
15.65%
EBIT to Interest (avg)
63.18
Debt to EBITDA (avg)
0.13
Net Debt to Equity (avg)
-0.60
Sales to Capital Employed (avg)
1.19
Tax Ratio
25.28%
Dividend Payout Ratio
76.22%
Pledged Shares
0
Institutional Holding
68.44%
ROCE (avg)
138.36%
ROE (avg)
39.51%

Valuation key factors

Factor
Value
P/E Ratio
39
Industry P/E
31
Price to Book Value
14.71
EV to EBIT
30.57
EV to EBITDA
26.17
EV to Capital Employed
35.13
EV to Sales
11.97
PEG Ratio
8.54
Dividend Yield
1.63%
ROCE (Latest)
110.25%
ROE (Latest)
36.04%

Technicals key factors

Indicator
Weekly
Monthly
MACD
Mildly Bearish
Mildly Bearish
RSI
No Signal
No Signal
Bollinger Bands
Bullish
Mildly Bullish
Moving Averages
Bullish (Daily)
KST
Mildly Bearish
Mildly Bearish
Dow Theory
Mildly Bearish
Mildly Bearish
OBV
No Trend
Bullish
stock-summary Technical Indicator Scale: Bearish, Mildly Bearish, Sideways, Mildly Bullish, Bullish  Turned 
stock-summaryShareholding
Shareholding Snapshot : Jun 2026stock-summary
Shareholding Compare (%holding) stock-summary
Majority shareholders

FIIs

Pledged Promoter Holdings

None

Mutual Funds

Held by 37 Schemes (15.72%)

FIIs

Held by 268 FIIs (44.88%)

Promoter with highest holding

None

Highest Public shareholder

Life Insurance Corporation Of India (4.72%)

Individual Investors Holdings

23.59%

stock-summaryFinancial
[
  {
    "link": "quarterly",
    "btn_text": "All Quarterly Results",
    "header": "Quarterly Results Snapshot (Consolidated) - Jun'26 - QoQ",
    "rhs": [
      {
        "prefix": "Net Sales ",
        "suffix": "QoQ Growth in quarter ended Jun 2026 is -0.05% vs 1.30% in Mar 2026",
        "dir": -1
      },
      {
        "prefix": "Consolidated Net Profit ",
        "suffix": "QoQ Growth in quarter ended Jun 2026 is 1.26% vs 0.71% in Mar 2026",
        "dir": 1
      }
    ],
    "table": {
      "header": [
        "Jun'26",
        "Mar'26",
        "Change(%)"
      ],
      "body": [
        {
          "field": "Net Sales",
          "val1": "395.03",
          "val2": "395.22",
          "chgp": "-0.05%",
          "chgp_class": "negative"
        },
        {
          "field": "Operating Profit (PBDIT) excl Other Income",
          "val1": "182.74",
          "val2": "183.11",
          "chgp": "-0.20%",
          "chgp_class": "negative"
        },
        {
          "field": "Interest",
          "val1": "1.48",
          "val2": "1.53",
          "chgp": "-3.27%",
          "chgp_class": "positive"
        },
        {
          "field": "Exceptional Items",
          "val1": "0.00",
          "val2": "0.00",
          "chgp": "",
          "chgp_class": "neutral"
        },
        {
          "field": "Consolidate Net Profit",
          "val1": "128.02",
          "val2": "126.43",
          "chgp": "1.26%",
          "chgp_class": "positive"
        },
        {
          "field": "Operating Profit Margin (Excl OI)",
          "val1": "46.26%",
          "val2": "46.33%",
          "chgp": "-0.07%",
          "chgp_class": "negative"
        }
      ]
    }
  },
  {
    "link": "half-yearly",
    "btn_text": "All Half Yearly Results",
    "header": "Half Yearly Results Snapshot (Consolidated) - Sep'25",
    "rhs": [
      {
        "prefix": "Net Sales ",
        "suffix": " Growth in half year ended Sep 2025 is 4.93% vs 29.87% in Sep 2024",
        "dir": -1
      },
      {
        "prefix": "Consolidated Net Profit ",
        "suffix": " Growth in half year ended Sep 2025 is -2.88% vs 43.41% in Sep 2024",
        "dir": -1
      }
    ],
    "table": {
      "header": [
        "Sep'25",
        "Sep'24",
        "Change(%)"
      ],
      "body": [
        {
          "field": "Net Sales",
          "val1": "730.89",
          "val2": "696.57",
          "chgp": "4.93%",
          "chgp_class": "positive"
        },
        {
          "field": "Operating Profit (PBDIT) excl Other Income",
          "val1": "321.89",
          "val2": "320.01",
          "chgp": "0.59%",
          "chgp_class": "positive"
        },
        {
          "field": "Interest",
          "val1": "3.78",
          "val2": "4.29",
          "chgp": "-11.89%",
          "chgp_class": "positive"
        },
        {
          "field": "Exceptional Items",
          "val1": "0.00",
          "val2": "0.00",
          "chgp": "",
          "chgp_class": "neutral"
        },
        {
          "field": "Consolidate Net Profit",
          "val1": "224.03",
          "val2": "230.68",
          "chgp": "-2.88%",
          "chgp_class": "negative"
        },
        {
          "field": "Operating Profit Margin (Excl OI)",
          "val1": "44.04%",
          "val2": "45.94%",
          "chgp": "-1.90%",
          "chgp_class": "negative"
        }
      ]
    }
  },
  {
    "link": "nine-monthly",
    "btn_text": "All Nine Monthly Results",
    "header": "Nine Monthly Results Snapshot (Consolidated) - Dec'25",
    "rhs": [
      {
        "prefix": "Net Sales ",
        "suffix": "YoY Growth in nine months ended Dec 2025 is 5.13% vs 29.08% in Dec 2024",
        "dir": -1
      },
      {
        "prefix": "Consolidated Net Profit ",
        "suffix": "YoY Growth in nine months ended Dec 2025 is -1.85% vs 42.39% in Dec 2024",
        "dir": -1
      }
    ],
    "table": {
      "header": [
        "Dec'25",
        "Dec'24",
        "Change(%)"
      ],
      "body": [
        {
          "field": "Net Sales",
          "val1": "1,121.03",
          "val2": "1,066.31",
          "chgp": "5.13%",
          "chgp_class": "positive"
        },
        {
          "field": "Operating Profit (PBDIT) excl Other Income",
          "val1": "500.79",
          "val2": "492.84",
          "chgp": "1.61%",
          "chgp_class": "positive"
        },
        {
          "field": "Interest",
          "val1": "5.46",
          "val2": "6.44",
          "chgp": "-15.22%",
          "chgp_class": "positive"
        },
        {
          "field": "Exceptional Items",
          "val1": "0.00",
          "val2": "0.00",
          "chgp": "",
          "chgp_class": "neutral"
        },
        {
          "field": "Consolidate Net Profit",
          "val1": "349.57",
          "val2": "356.17",
          "chgp": "-1.85%",
          "chgp_class": "negative"
        },
        {
          "field": "Operating Profit Margin (Excl OI)",
          "val1": "44.67%",
          "val2": "46.22%",
          "chgp": "-1.55%",
          "chgp_class": "negative"
        }
      ]
    }
  },
  {
    "link": "annual",
    "btn_text": "All Annual Results",
    "header": "Annual Results Snapshot (Consolidated) - Mar'26",
    "rhs": [
      {
        "prefix": "Net Sales ",
        "suffix": "YoY Growth in year ended Mar 2026 is 6.59% vs 25.16% in Mar 2025",
        "dir": -1
      },
      {
        "prefix": "Consolidated Net Profit ",
        "suffix": "YoY Growth in year ended Mar 2026 is 1.24% vs 32.96% in Mar 2025",
        "dir": -1
      }
    ],
    "table": {
      "header": [
        "Mar'26",
        "Mar'25",
        "Change(%)"
      ],
      "body": [
        {
          "field": "Net Sales",
          "val1": "1,516.25",
          "val2": "1,422.48",
          "chgp": "6.59%",
          "chgp_class": "positive"
        },
        {
          "field": "Operating Profit (PBDIT) excl Other Income",
          "val1": "683.90",
          "val2": "652.22",
          "chgp": "4.86%",
          "chgp_class": "positive"
        },
        {
          "field": "Interest",
          "val1": "6.98",
          "val2": "8.47",
          "chgp": "-17.59%",
          "chgp_class": "positive"
        },
        {
          "field": "Exceptional Items",
          "val1": "0.00",
          "val2": "0.00",
          "chgp": "",
          "chgp_class": "neutral"
        },
        {
          "field": "Consolidate Net Profit",
          "val1": "476.01",
          "val2": "470.19",
          "chgp": "1.24%",
          "chgp_class": "positive"
        },
        {
          "field": "Operating Profit Margin (Excl OI)",
          "val1": "45.10%",
          "val2": "45.85%",
          "chgp": "-0.75%",
          "chgp_class": "negative"
        }
      ]
    }
  }
]

Quarterly Results Snapshot (Consolidated) - Jun'26 - QoQstock-summary

Jun'26
Mar'26
Change(%)
Net Sales
395.03
395.22
-0.05%
Operating Profit (PBDIT) excl Other Income
182.74
183.11
-0.20%
Interest
1.48
1.53
-3.27%
Exceptional Items
0.00
0.00
Consolidate Net Profit
128.02
126.43
1.26%
Operating Profit Margin (Excl OI)
46.26%
46.33%
-0.07%
Values in Rs Cr.
Direction Arrows
Net Sales

QoQ Growth in quarter ended Jun 2026 is -0.05% vs 1.30% in Mar 2026

Direction Arrows
Consolidated Net Profit

QoQ Growth in quarter ended Jun 2026 is 1.26% vs 0.71% in Mar 2026

Half Yearly Results Snapshot (Consolidated) - Sep'25stock-summary

Sep'25
Sep'24
Change(%)
Net Sales
730.89
696.57
4.93%
Operating Profit (PBDIT) excl Other Income
321.89
320.01
0.59%
Interest
3.78
4.29
-11.89%
Exceptional Items
0.00
0.00
Consolidate Net Profit
224.03
230.68
-2.88%
Operating Profit Margin (Excl OI)
44.04%
45.94%
-1.90%
Values in Rs Cr.
Direction Arrows
Net Sales

Growth in half year ended Sep 2025 is 4.93% vs 29.87% in Sep 2024

Direction Arrows
Consolidated Net Profit

Growth in half year ended Sep 2025 is -2.88% vs 43.41% in Sep 2024

Nine Monthly Results Snapshot (Consolidated) - Dec'25stock-summary

Dec'25
Dec'24
Change(%)
Net Sales
1,121.03
1,066.31
5.13%
Operating Profit (PBDIT) excl Other Income
500.79
492.84
1.61%
Interest
5.46
6.44
-15.22%
Exceptional Items
0.00
0.00
Consolidate Net Profit
349.57
356.17
-1.85%
Operating Profit Margin (Excl OI)
44.67%
46.22%
-1.55%
Values in Rs Cr.
Direction Arrows
Net Sales

YoY Growth in nine months ended Dec 2025 is 5.13% vs 29.08% in Dec 2024

Direction Arrows
Consolidated Net Profit

YoY Growth in nine months ended Dec 2025 is -1.85% vs 42.39% in Dec 2024

Annual Results Snapshot (Consolidated) - Mar'26stock-summary

Mar'26
Mar'25
Change(%)
Net Sales
1,516.25
1,422.48
6.59%
Operating Profit (PBDIT) excl Other Income
683.90
652.22
4.86%
Interest
6.98
8.47
-17.59%
Exceptional Items
0.00
0.00
Consolidate Net Profit
476.01
470.19
1.24%
Operating Profit Margin (Excl OI)
45.10%
45.85%
-0.75%
Values in Rs Cr.
Direction Arrows
Net Sales

YoY Growth in year ended Mar 2026 is 6.59% vs 25.16% in Mar 2025

Direction Arrows
Consolidated Net Profit

YoY Growth in year ended Mar 2026 is 1.24% vs 32.96% in Mar 2025

stock-summaryCompany CV
About Computer Age Management Services Ltd stock-summary
stock-summary
Computer Age Management Services Ltd
Small Cap
Capital Markets
Computer Age Management Services Limited (CAMS) is India's largest Mutual Fund Transfer Agency serving over 68% of assets of the Indian mutual fund industry. As an integral part of the India's financial infrastructure, CAMS has built a reputation as the leading Transfer Agency to the Asset Management Industry of India and technology enabled service solutions partner to Private Equity Funds, Banks and Non-Banking Finance Companies.
Company Coordinates stock-summary
Icon
No Company Details Available