
Compare KFin Technolog. with Similar Stocks
Stock DNA
Capital Markets
INR 15,209 Cr (Small Cap)
43.00
22
1.34%
0.03
21.10%
9.29
Total Returns (Price + Dividend) 
Latest dividend: 11.939259094448772 per share ex-dividend date: Jul-15-2026
Risk Adjusted Returns v/s
Returns Beta

News

KFin Technologies Ltd is Rated Sell by MarketsMOJO
KFin Technologies Ltd is rated 'Sell' by MarketsMOJO, with this rating last updated on 01 September 2025. However, the analysis and financial metrics discussed here reflect the stock's current position as of 16 July 2026, providing investors with an up-to-date view of the company’s fundamentals, valuation, financial trends, and technical outlook.
Read full news article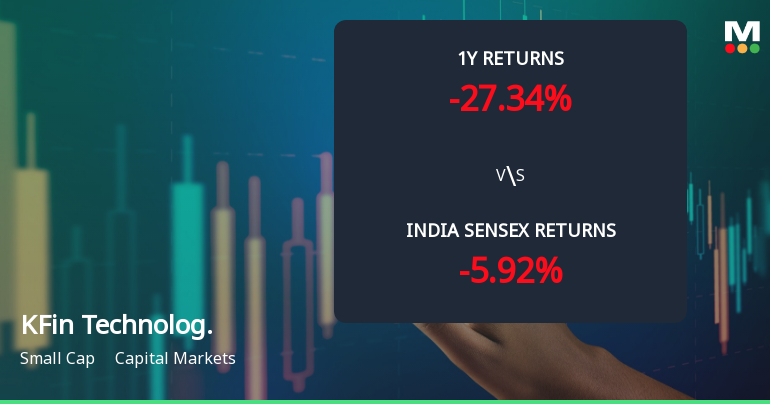
KFin Technologies Ltd Technical Momentum Shifts Amid Mixed Market Signals
KFin Technologies Ltd, a small-cap player in the capital markets sector, has exhibited a notable shift in its technical momentum, moving from a mildly bearish stance to a sideways trend. Despite a recent upgrade in short-term momentum indicators, the stock’s overall technical profile remains mixed, reflecting a complex interplay of bullish and bearish signals across weekly and monthly timeframes.
Read full news article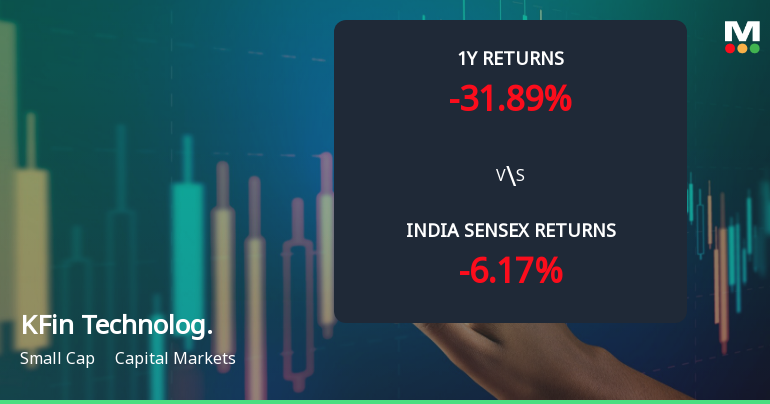
KFin Technologies Ltd Technical Momentum Shifts Amid Mixed Market Signals
KFin Technologies Ltd, a small-cap player in the Capital Markets sector, has experienced a notable shift in its technical momentum, reflecting a complex interplay of bullish and bearish signals across multiple timeframes. Despite a modest day gain of 0.30%, the stock’s broader technical indicators suggest a transition from a sideways trend to a mildly bearish stance, prompting a downgrade in its Mojo Grade from Hold to Sell as of 1 September 2025.
Read full news article Announcements
Corporate Actions

24 Jul 2026

KFin Technologies Ltd has declared 120% dividend, ex-date: 15 Jul 26

No Splits history available

No Bonus history available

No Rights history available
Quality key factors
Valuation key factors
Technicals key factors
 Technical Indicator Scale: Bearish, Mildly Bearish, Sideways, Mildly Bullish, Bullish Turned
 Shareholding Snapshot : Mar 2026
Shareholding Compare (%holding)
FIIs
None
Held by 28 Schemes (13.11%)
Held by 197 FIIs (26.26%)
General Atlantic Singapore Fund Pte. Ltd. (21.93%)
Compar Estates And Agencies Private Limited (10.67%)
12.0%
Quarterly Results Snapshot (Consolidated) - Mar'26 - QoQ

QoQ Growth in quarter ended Mar 2026 is -6.35% vs 19.93% in Dec 2025
QoQ Growth in quarter ended Mar 2026 is -11.78% vs -1.41% in Dec 2025
Half Yearly Results Snapshot (Consolidated) - Sep'25
Growth in half year ended Sep 2025 is 12.60% vs 32.67% in Sep 2024
Growth in half year ended Sep 2025 is 8.37% vs 50.25% in Sep 2024
Nine Monthly Results Snapshot (Consolidated) - Dec'25
YoY Growth in nine months ended Dec 2025 is 18.08% vs 32.64% in Dec 2024
YoY Growth in nine months ended Dec 2025 is 6.05% vs 44.29% in Dec 2024
Annual Results Snapshot (Consolidated) - Mar'26
YoY Growth in year ended Mar 2026 is 19.32% vs 30.23% in Mar 2025
YoY Growth in year ended Mar 2026 is 3.33% vs 35.19% in Mar 2025
About KFin Technologies Ltd

Company Coordinates


