
Compare Canara Robeco with Similar Stocks
Stock DNA
Capital Markets
INR 4,952 Cr (Small Cap)
24.00
20
0.62%
0.03
30.02%
7.07
Total Returns (Price + Dividend) 
Latest dividend: 1.5 per share ex-dividend date: Dec-22-2025
Risk Adjusted Returns v/s
Returns Beta

News
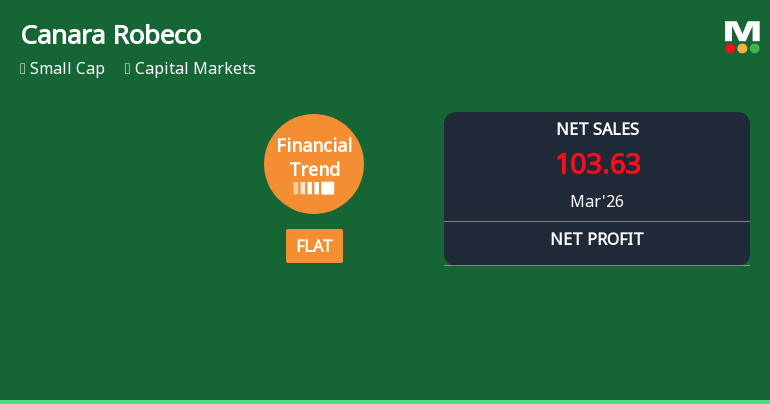
Canara Robeco Asset Management Posts Flat Quarterly Performance Amid Declining Margins
Canara Robeco Asset Management Company Ltd has reported a flat financial performance for the quarter ended March 2026, marking a shift from previous negative trends. Despite some stabilisation in financial metrics, key indicators such as profit after tax and net sales have declined compared to the preceding four-quarter averages, signalling ongoing challenges in the capital markets sector.
Read full news article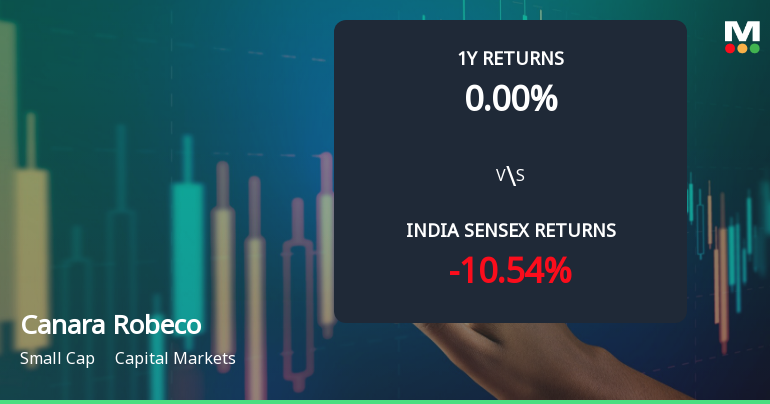
Canara Robeco Asset Management: Technical Momentum Shifts Amid Market Pressure
Canara Robeco Asset Management Company Ltd has experienced a notable shift in its technical momentum, moving from a mildly bullish stance to a sideways trend as of early June 2026. This change reflects growing market uncertainty and a weakening price momentum, compounded by a 2.54% decline in the stock price on 9 June 2026, signalling caution for investors in this small-cap capital markets player.
Read full news article
Canara Robeco Asset Management Company Ltd is Rated Sell
Canara Robeco Asset Management Company Ltd is rated 'Sell' by MarketsMOJO, with this rating last updated on 26 May 2026. However, the analysis and financial metrics discussed here reflect the stock's current position as of 08 June 2026, providing investors with the latest insights into its performance and outlook.
Read full news article Announcements
Announcement under Regulation 30 (LODR)-Analyst / Investor Meet - Intimation
02-Jun-2026 | Source : BSECompany wish to inform that the Management of the Company will meet the investors/analysts on Wednesday June 10 2026.
Announcement under Regulation 30 (LODR)-Change in Management
01-Jun-2026 | Source : BSEAppointment of Mr. Edwin (Eduard) Van der Burg as the new Chief Operating Officer (in the category of Senior Management Personnel) in place of Ms. Hilde Faber with effect from June 1 2026.
Announcement under Regulation 30 (LODR)-Analyst / Investor Meet - Intimation
24-May-2026 | Source : BSECompany wish to inform that the Management of the Company will meet the investors/analysts on Wednesday May 27 2026.
Corporate Actions

No Upcoming Board Meetings

Canara Robeco Asset Management Company Ltd has declared 25% dividend, ex-date: 16 Jul 26

No Splits history available

No Bonus history available

No Rights history available
Quality key factors
Valuation key factors
Technicals key factors
 Technical Indicator Scale: Bearish, Mildly Bearish, Sideways, Mildly Bullish, Bullish Turned
 Shareholding Snapshot : Mar 2026
Shareholding Compare (%holding)
Promoters
None
Held by 14 Schemes (9.4%)
Held by 13 FIIs (1.72%)
Canara Bank (38.0%)
Nippon Life India Trustee Ltd-a/c Nippon India Small Cap Fund (2.49%)
10.7%
Quarterly Results Snapshot (Standalone) - Mar'26 - QoQ

QoQ Growth in quarter ended Mar 2026 is -14.58% vs 12.70% in Dec 2025
QoQ Growth in quarter ended Mar 2026 is -21.59% vs 8.29% in Dec 2025
Half Yearly Results Snapshot (Standalone) - Sep'25
Not Applicable: The company has declared_date for only one period
Not Applicable: The company has declared_date for only one period
Nine Monthly Results Snapshot (Standalone) - Dec'25
Not Applicable: The company has declared_date for only one period
Not Applicable: The company has declared_date for only one period
Annual Results Snapshot (Standalone) - Mar'26
YoY Growth in year ended Mar 2026 is 12.38% vs 26.91% in Mar 2025
YoY Growth in year ended Mar 2026 is 6.87% vs 26.29% in Mar 2025
About Canara Robeco Asset Management Company Ltd

Company Coordinates


