Candour Techtex

  • Market Cap: Micro Cap
  • Industry: Plastic Products - Industrial
  • ISIN: INE713D01055
  • NSEID:
  • BSEID: 522292
INR
143.90
-1.1 (-0.76%)
BSENSE

Mar 27

BSE+NSE Vol: 19.8 k

  • Price Points
  • Score
  • Mojo Parameters
  • Total Return
  • News and Corporate Actions
  • Key factors
  • Shareholding
  • Financials
  • CompanyCV
stock-summaryPrice Point
High/Low

1Day

52 Week

Valuation
Technical
Day's Volume

CASH

19.8 k (-59.57%) Volume

Shareholding (Dec 2025)

FII

0.00%

Held by 0 FIIs

DII

0.00%

Held by 0 DIIs

Promoter

32.89%

Who are in the management team of Candour Techtex?

06-Jun-2025

As of March 2022, the management team of Candour Techtex includes Jayesh R Mehta (Chairman & Managing Director), Amita J Mehta (Director), Bharat Bhatia, Rameshchand Garg, and Mansi Harsh Dave (Independent Directors), Sharmila Hiralal Amin (Executive Director), and Kirti Pathak (Company Secretary & Compliance Officer). They are responsible for the company's strategic direction and operations.

As of March 2022, the management team of Candour Techtex includes the following individuals:<BR><BR>1. Jayesh R Mehta - Chairman & Managing Director<BR>2. Amita J Mehta - Director<BR>3. Bharat Bhatia - Independent Director<BR>4. Rameshchand Garg - Independent Director<BR>5. Sharmila Hiralal Amin - Executive Director<BR>6. Kirti Pathak - Company Secretary & Compliance Officer<BR>7. Mansi Harsh Dave - Independent Director<BR><BR>These members play key roles in guiding the company's strategic direction and operations.

View full answer

Has Candour Techtex declared dividend?

06-Jun-2025

No Dividend History Available

What is the technical trend for Candour Techtex?

09-Jun-2025

As of April 25, 2025, Candour Techtex shows a mildly bullish trend overall, supported by daily moving averages and a bullish monthly MACD, despite mixed signals from weekly indicators like the MACD and Bollinger Bands.

As of 25 April 2025, the technical trend for Candour Techtex has changed from bullish to mildly bullish. The weekly MACD indicates a mildly bearish stance, while the monthly MACD remains bullish. The daily moving averages show a mildly bullish trend, supporting the overall mildly bullish outlook. However, the weekly Bollinger Bands are bearish, and the KST is bearish on a weekly basis but bullish monthly. The Dow Theory reflects a mildly bearish stance weekly and mildly bullish monthly, which adds to the mixed signals. Overall, the current technical stance is mildly bullish, with key indicators being the daily moving averages and the monthly MACD.

View full answer

Who are the peers of the Candour Techtex?

16-Jul-2025

Candour Techtex's peers include Bright Brothers, Tainwala Chem., Texmo Pipes, Caprihans India, Hind.Adhesive, Guj. Toolroom, National Plastic, Rungta Irrigatn., and G M Polyplast. In terms of management risk, growth, and capital structure, Candour Techtex is rated below average, with a 1-year return of 121.97%, outperforming most peers.

Peers: The peers of Candour Techtex are Bright Brothers, Tainwala Chem., Texmo Pipes, Caprihans India, Hind.Adhesive, Guj. Toolroom, National Plastic, Rungta Irrigatn., and G M Polyplast.<BR><BR>Quality Snapshot: Excellent management risk is observed at Guj. Toolroom, while Average management risk is found at Hind.Adhesive, Caprihans India, and National Plastic, and the rest. Below Average management risk is noted at Bright Brothers, Tainwala Chem., Texmo Pipes, Candour Techtex, Rungta Irrigatn., and G M Polyplast. Growth is Excellent at Guj. Toolroom, Good at Candour Techtex, Hind.Adhesive, and Rungta Irrigatn., and the rest, while Average growth is seen at National Plastic, and Below Average growth is found at Tainwala Chem., Texmo Pipes, Caprihans India, and G M Polyplast. Capital Structure is Excellent at Guj. Toolroom, Average at Texmo Pipes, and Below Average at Bright Brothers, Tainwala Chem., Caprihans India, Candour Techtex, Hind.Adhesive, National Plastic, Rungta Irrigatn., and G M Polyplast.<BR><BR>Return Snapshot: The peer with the highest 1-year return is Bright Brothers at 115.98%, while the lowest is G M Polyplast at -56.64%. Candour Techtex's 1-year return of 121.97% is higher than both. Additionally, peers with negative six-month returns include Hind.Adhesive, Guj. Toolroom, National Plastic, Rungta Irrigatn., and G M Polyplast.

View full answer

What does Candour Techtex do?

17-Jul-2025

Candour Techtex Ltd assembles TFO twisting machines and sources machinery in the industrial plastic products sector. As of March 2025, it reported net sales of 538 Cr and a net loss of 7 Cr, with a market cap of INR 180 Cr.

Overview: <BR>Candour Techtex Ltd is engaged in assembling TFO twisting machines and sourcing various machinery and equipment within the Plastic Products - Industrial industry, classified as a Micro Cap company.<BR><BR>History: <BR>Candour Techtex Ltd was incorporated in June 1986, originally known as Amita Texturisers Pvt Ltd and later rebranded from Chandni Textiles Engineering Industries Ltd. The latest quarterly results reported net sales and profit for the period ending March 2025.<BR><BR>Financial Snapshot: <BR>Most recent Net Sales: 538 Cr (Quarterly Results - Mar 2025) <BR>Most recent Net Profit: -7 Cr (Quarterly Results - Mar 2025) <BR>Market-cap value: INR 180 Cr (Micro Cap) <BR><BR>Key Metrics: <BR>P/E: 179.00 <BR>Industry P/E: 90 <BR>Dividend Yield: 0.00% <BR>Debt-Equity: 1.15 <BR>Return on Equity: 2.33% <BR>Price to Book: 6.13 <BR><BR>Contact Details: <BR>Address: 110 TV Industrial Estate, 52 S K Ahire Marg Worli Mumbai Maharashtra : 400030 <BR>Tel: 91-09324802991 <BR>Email: jrgroup@jrmehta.com <BR>Website: http://www.cteil.com

View full answer

Who are the top shareholders of the Candour Techtex?

17-Jul-2025

The top shareholders of Candour Techtex are Jayesh Ramniklal Mehta with 25.43%, Mangal Keshav Capital Limited at 16.55%, and individual investors holding a combined 38.72%. There are no institutional holdings from mutual funds or foreign investors.

The top shareholders of Candour Techtex include Jayesh Ramniklal Mehta, who holds the largest share at 25.43%. The highest public shareholder is Mangal Keshav Capital Limited, with a stake of 16.55%. Additionally, individual investors collectively hold 38.72% of the company's shares. There are no institutional holdings from mutual funds or foreign institutional investors.

View full answer

How big is Candour Techtex?

24-Jul-2025

As of 24th July, Candour Techtex Ltd has a market capitalization of 178.00 Cr, with recent net sales of 188.11 Cr and a net profit of 0.67 Cr. The latest balance sheet shows shareholder's funds of 22.37 Cr and total assets of 27.20 Cr.

As of 24th July, Candour Techtex Ltd has a market capitalization of 178.00 Cr, categorizing it as a Micro Cap company.<BR><BR>For the latest four quarters, the company reported Net Sales of 188.11 Cr and a Net Profit of 0.67 Cr.<BR><BR>The latest annual period for the balance sheet is March 2017, with Shareholder's Funds amounting to 22.37 Cr and Total Assets valued at 27.20 Cr.

View full answer

Is Candour Techtex overvalued or undervalued?

18-Nov-2025

As of November 17, 2025, Candour Techtex is considered risky and overvalued with troubling financial ratios, including a PE ratio of -107.51 and an EV to EBITDA of 132.66, especially when compared to peers like Bajaj Steel Industries, which has a PE ratio of 19.61, indicating that its strong year-to-date return may not be sustainable.

As of 17 November 2025, the valuation grade for Candour Techtex has moved from very expensive to risky, indicating a significant shift in its financial outlook. The company appears to be overvalued, given its troubling financial ratios, including a PE ratio of -107.51, an EV to EBITDA of 132.66, and a ROE of -6.26%. These metrics suggest that the company's earnings are not only negative but also that it is trading at a high valuation relative to its earnings potential.<BR><BR>When compared to peers, Candour Techtex's valuation stands out unfavorably. For instance, Bajaj Steel Industries, categorized as attractive, has a PE ratio of 19.61 and an EV to EBITDA of 12.52, while LMW, considered very expensive, has a PE ratio of 139.43. The stark contrast in these ratios highlights the overvaluation of Candour Techtex. Despite a strong year-to-date return of 39.60% compared to the Sensex's 8.72%, the underlying financial metrics suggest that the stock may not sustain its current price levels in the long term.

View full answer

How has been the historical performance of Candour Techtex?

01-Dec-2025

Candour Techtex has demonstrated significant growth in net sales, increasing from 10.86 Cr in Mar'19 to 188.10 Cr in Mar'25, with profitability recovering in the latest fiscal year, including a profit after tax of 0.67 Cr and an operating profit margin of 3.33%. Overall, the company has shown a positive trend in both sales and profitability.

Answer:<BR>The historical performance of Candour Techtex shows a fluctuating trend in net sales and profitability over the years.<BR><BR>Breakdown:<BR>Candour Techtex's net sales have increased from 10.86 Cr in Mar'19 to 188.10 Cr in Mar'25, with a notable jump from 59.63 Cr in Mar'23. Total operating income followed a similar trajectory, reaching 188.10 Cr in Mar'25. The company's total expenditure, excluding depreciation, was 181.84 Cr in Mar'25, which is a slight decrease from 182.61 Cr in Mar'24 but significantly higher than 59.42 Cr in Mar'23. Operating profit (PBDIT) has shown improvement, rising to 8.14 Cr in Mar'25 from 4.62 Cr in Mar'24, while profit before tax turned positive at 1.32 Cr in Mar'25 after a loss of 1.48 Cr in Mar'24. Profit after tax also recovered to 0.67 Cr in Mar'25 from a loss of 1.06 Cr in Mar'24. The earnings per share (EPS) reflect this recovery, increasing to 0.37 in Mar'25 from -0.63 in Mar'24. The company's operating profit margin improved to 3.33% in Mar'25, while the profit after tax margin reached 0.36%. Overall, Candour Techtex has shown significant growth in sales and profitability, particularly in the latest fiscal year.

View full answer

When is the next results date for Candour Techtex Ltd?

11-Feb-2026

The next results date for Candour Techtex Ltd is 14 February 2026.

The next results date for Candour Techtex Ltd is scheduled for 14 February 2026.

View full answer

Are Candour Techtex Ltd latest results good or bad?

14-Feb-2026

Candour Techtex Ltd's latest results are concerning, showing a net profit of ₹-1.08 crores, a 17.39% decline from the previous quarter, and a 303.77% drop year-on-year, alongside a 69.44% decrease in revenue. These figures indicate significant operational challenges and raise doubts about the company's sustainability.

The latest results for Candour Techtex Ltd are quite concerning. In Q2 FY26, the company reported a net profit of ₹-1.08 crores, which marks a significant decline of 17.39% compared to the previous quarter and a staggering 303.77% drop year-on-year. Revenue also saw a catastrophic fall, plummeting 69.44% quarter-on-quarter and 74.12% year-on-year, resulting in the lowest quarterly revenue in recent history at ₹10.29 crores.<BR><BR>Additionally, the operating margin has collapsed to just 1.36%, down from 5.26% a year ago, indicating severe operational challenges. The profit after tax (PAT) margin is now at -10.50%, a stark contrast to the positive margins seen in the previous year. <BR><BR>Overall, these results reflect a dramatic deterioration in financial performance, raising serious questions about the company's sustainability and operational execution. Investors are likely to view these results as bad, given the ongoing losses and declining revenues.

View full answer

Should I buy, sell or hold Candour Techtex Ltd?

15-Feb-2026

Why is Candour Techtex Ltd falling/rising?

17-Mar-2026

As of 17-Mar, Candour Techtex Ltd's stock price is at Rs 144.90, down 1.96%, with a significant drop in investor participation and a 6.61% decline over the past month. Despite a strong 55.56% increase over the past year, the stock is currently showing signs of a weakening trend.

As of 17-Mar, Candour Techtex Ltd's stock price is falling, currently at Rs 144.90, reflecting a decrease of Rs 2.9 or 1.96%. This decline is part of a broader trend, as the stock has underperformed the sector by 1.61% today and has seen a significant drop in investor participation, with delivery volume falling by 80.56% compared to the 5-day average. Additionally, the stock reached an intraday low of Rs 141.5, which represents a 4.26% decrease. <BR><BR>In the context of recent performance, the stock has experienced a 6.61% decline over the past month and a 5.14% decline year-to-date, although it has shown strong growth over the past year with a 55.56% increase. Despite being above the 200-day moving average, it is currently below the shorter-term moving averages, indicating a potential weakening trend. Overall, these factors contribute to the current downward movement in the stock price of Candour Techtex Ltd.

View full answer

Why is Candour Techtex Ltd falling/rising?

19-Mar-2026

As of 18-Mar, Candour Techtex Ltd's stock price is currently at 146.80, reflecting a 1.52% increase. Despite recent declines, strong historical performance and increased investor participation indicate positive sentiment towards the stock.

As of 18-Mar, Candour Techtex Ltd's stock price is rising, currently at 146.80, reflecting an increase of 2.2 (1.52%). The stock opened with a gain of 2.32% today and reached an intraday high of Rs 149.5, which is a 3.39% increase. Additionally, the stock has outperformed its sector by 1.33%. <BR><BR>Investor participation has also increased, with a delivery volume of 82.77k on 17 March, which is up by 37.96% compared to the 5-day average delivery volume. This rising interest from investors indicates a positive sentiment towards the stock. <BR><BR>Despite some recent declines over the past week and month, where the stock fell by 3.36% and 4.30% respectively, its strong performance over the past year (+54.12%) and three years (+241.47%) suggests a solid long-term growth trajectory. The stock is currently trading above its 200-day moving average, although it is below its shorter-term moving averages, indicating some volatility. Overall, the combination of today's positive performance, increased investor participation, and strong historical returns contributes to the current rise in Candour Techtex Ltd's stock price.

View full answer

Why is Candour Techtex Ltd falling/rising?

19-Mar-2026

As of 19-Mar, Candour Techtex Ltd's stock price is at 143.65, reflecting a decline of 1.68%. Despite a significant annual growth of 50.18%, recent trends show a downturn with increased volatility and decreased investor participation.

As of 19-Mar, Candour Techtex Ltd's stock price is falling, currently at 143.65, which reflects a decrease of 2.45 or 1.68%. This decline is evident in the stock's performance over various periods, with a 1-week drop of 3.91% and a 1-month decrease of 5.96%. Although the stock has shown significant growth over the past year, with a 50.18% increase, the recent trends indicate a downturn.<BR><BR>Today's trading activity highlights a high level of volatility, with an intraday volatility of 5.06%. The stock has also traded in a wide range of Rs 15.3, suggesting fluctuations in investor sentiment. Despite outperforming the sector by 0.68% today, the overall market sentiment appears to be negative, as the Textile - Machinery sector has fallen by 2.36%. Additionally, there has been a decline in investor participation, with delivery volume decreasing by 3.99% compared to the 5-day average.<BR><BR>The stock's moving averages indicate that it is currently higher than the 200-day moving average but lower than the 5-day, 20-day, 50-day, and 100-day moving averages, which may contribute to the perception of weakness in the stock. Overall, these factors collectively explain the current decline in Candour Techtex Ltd's stock price.

View full answer

Why is Candour Techtex Ltd falling/rising?

20-Mar-2026

As of 20-Mar, Candour Techtex Ltd's stock price is currently at 144.25, showing a slight rise today but reflecting a decline over the past week and month. The stock has performed well over the past year, but decreased investor participation and mixed moving average trends indicate potential concerns.

As of 20-Mar, Candour Techtex Ltd's stock price is rising, currently at 144.25, with a change of 0.45 (0.31%) upward. This increase is notable as it outperformed the sector by 3.32% today, despite the broader textile machinery sector experiencing a decline of 2.59%. <BR><BR>However, it's important to consider the overall performance trends. Over the past week, the stock has decreased by 1.94%, and it has shown a decline of 5.44% over the past month. Year-to-date, the stock is down 5.56%, although it has performed exceptionally well over the past year with a gain of 52.65%. <BR><BR>The stock's current price is higher than the 200-day moving average but lower than the 5-day, 20-day, 50-day, and 100-day moving averages, indicating mixed short-term performance. Additionally, there has been a significant drop in investor participation, with delivery volume falling by 72.74% compared to the 5-day average, which could suggest reduced interest among investors.<BR><BR>In summary, while the stock is experiencing a slight rise today, the overall trend shows a decline in the short term, influenced by decreased investor participation and sector performance.

View full answer

Why is Candour Techtex Ltd falling/rising?

24-Mar-2026

As of 23-Mar, Candour Techtex Ltd's stock price is Rs 144.00, down 1.0%. Despite today's gains, the stock has a negative trend with declines over the past week, month, and year-to-date, alongside reduced investor participation.

As of 23-Mar, Candour Techtex Ltd's stock price is currently at Rs 144.00, reflecting a decrease of Rs 1.45 or 1.0%. The stock has shown a performance today that outperformed its sector by 6.41%, opening with a gain of 2.41% and reaching an intraday high of Rs 148.95. However, it also experienced a low of Rs 142, indicating volatility within the trading day.<BR><BR>Despite today's initial gains, the overall trend for the stock has been negative, with a decline of 2.57% over the past week and 6.68% over the past month. Year-to-date, the stock is down 5.73%, although it has performed well over the longer term, with a 50.94% increase over the past year and a remarkable 269.33% rise over the past three years.<BR><BR>The stock's current price is higher than the 200-day moving average but lower than the 5-day, 20-day, 50-day, and 100-day moving averages, suggesting mixed signals regarding its short-term performance. Additionally, there has been a significant drop in investor participation, with delivery volume falling by 84.34% compared to the 5-day average, which may indicate reduced interest among investors.<BR><BR>Overall, while there were positive movements today, the stock's recent performance and declining investor participation contribute to its current downward price trend.

View full answer

Why is Candour Techtex Ltd falling/rising?

26-Mar-2026

As of 25-Mar, Candour Techtex Ltd's stock price is rising to Rs 145.00, up 2.51% after a trend reversal. Despite recent gains, the company faces significant financial challenges, including operating losses and weak debt servicing capabilities, indicating a risky investment profile.

As of 25-Mar, Candour Techtex Ltd's stock price is rising, currently at Rs 145.00, reflecting an increase of Rs 3.55 or 2.51%. This upward movement follows a trend reversal after two consecutive days of decline. The stock opened with a gain of 2.9% today and reached an intraday high of Rs 145.55. Additionally, it has outperformed its sector by 1.7% today.<BR><BR>Despite the positive performance today, the stock has shown a decline over the past week and month, with returns of -0.75% and -6.48%, respectively. However, it has demonstrated strong long-term performance, with a remarkable increase of 52.71% over the past year and an impressive 286.36% over the past three years. <BR><BR>It is important to note that while the stock is currently rising, the company faces significant challenges, including operating losses and negative results over the last three quarters. The company's ability to service its debt is weak, and it has reported a negative EBITDA, indicating a risky investment profile. Nonetheless, the recent price increase may be attributed to short-term trading dynamics and a temporary reversal in sentiment, despite the underlying financial difficulties.

View full answer

Which are the latest news on Candour Techtex?

27-Mar-2026

iScoreScore
Click here to find our call on this stock
Strong Sell
Sell
Hold
Buy
Strong Buy

Dashboard

1

With a Operating Losses, the company has a Weak Long Term Fundamental Strength

  • Company's ability to service its debt is weak with a poor EBIT to Interest (avg) ratio of -0.19
  • The company has been able to generate a Return on Equity (avg) of 3.42% signifying low profitability per unit of shareholders funds
2

With a fall in Operating Profit of -150.94%, the company declared Very Negative results in Dec 25

3

Risky - Negative EBITDA

stock-summaryMojo Parameters

Mojo Parameters

Loading Valuation Snapshot...

Stock DNA

stock-summary
Industry

Plastic Products - Industrial

stock-summary
Market cap

INR 350 Cr (Micro Cap)

stock-summary
P/E

NA (Loss Making)

stock-summary
Industry P/E

68

stock-summary
Dividend Yield

0.00%

stock-summary
Debt Equity

0.38

stock-summary
Return on Equity

-7.96%

stock-summary
Price to Book

8.36

Revenue and Profits:
Net Sales:
7 Cr
(Quarterly Results - Dec 2025)
Net Profit:
-1 Cr
stock-summaryTotal Returns
Total Returns (Price + Dividend) stock-summary
Dividend Yield (0%)
TimePeriod
Price Return
Dividend Return
Total Return
3 Months
-4.83%
0%
-4.83%
6 Months
56.19%
0%
56.19%
1 Year
55.6%
0%
55.6%
2 Years
260.2%
0%
260.2%
3 Years
289.02%
0%
289.02%
4 Years
227.05%
0%
227.05%
5 Years
152.01%
0%
152.01%

Candour Techtex for the last several years.

Risk Adjusted Returns v/s stock-summary
Returns Beta
Icon
Beta has not been calculated since enough price history is not available
stock-summaryNews & Corporate Actions

News

Why is Candour Techtex Ltd falling/rising?

Recent Price Movement and Market Context

On the day in question, Candour Techtex opened with a positive gap, rising 2.92% to an intraday high of ₹147.85. However, the stock reversed course sharply, hitting a low of ₹140, down 2.54% intraday, and ultimately closing with a loss of ₹3.10. This decline marked the second consecutive day of losses, with the stock falling 3.37% over this short period. Notably, the weighted average price indicates that a greater volume of shares traded closer to the day’s low, signalling selling pressure towards the end of the session.

The stock underperformed its sector, Textile - Machinery, which gained 3.01% on the same day. This divergence suggests that while the broader sector showed strength, Candour Techtex faced company-specific headwi...

Read full news article
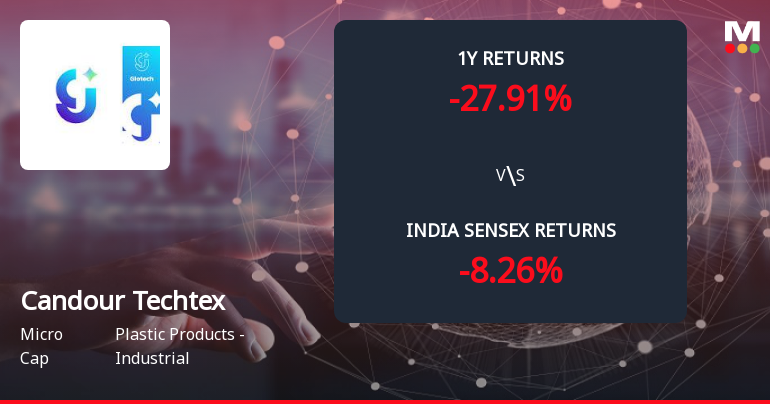
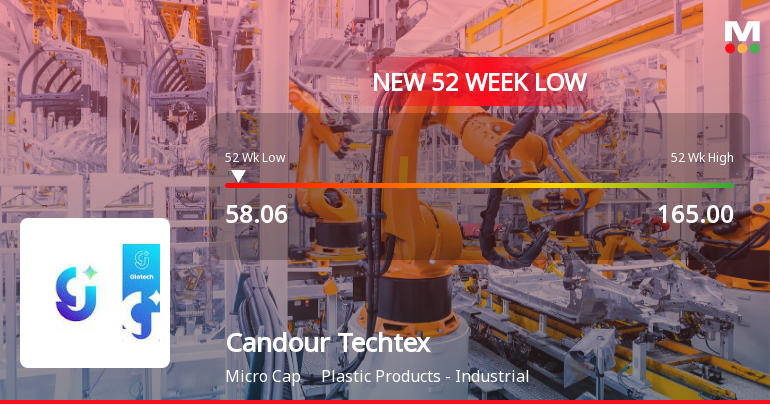
Announcements stock-summary

Closure of Trading Window

27-Mar-2026 | Source : BSE

Intimation of Closure of Trading Window for year ended March 31 2026.

Announcement Under Regulation 30 (LODR) Regulation 2015

17-Feb-2026 | Source : BSE

Clarification Regarding Intimation Of Allotment Dated February 16 2026

Announcement Under Regulation 30 Of SEBI (LODR) Regulation 2015.

16-Feb-2026 | Source : BSE

Disclosure under Regulation 30 of the SEBI (LODR) Regulation 2015 and Regulation 163 of the SEBI (ICDR) Regulation 2018 regarding clerical corrections in the prefrential allottee list.

Corporate Actions stock-summary

stock-summary
BOARD MEETING

No Upcoming Board Meetings

stock-summary
DIVIDEND

No Dividend history available

stock-summary
SPLITS

Candour Techtex Ltd has announced 10:1 stock split, ex-date: 08 Dec 16

stock-summary
BONUS

No Bonus history available

stock-summary
RIGHTS

No Rights history available

stock-summaryKey Factors

Quality key factors stock-summary

Factor
Value
Sales Growth (5y)
16.48%
EBIT Growth (5y)
-231.15%
EBIT to Interest (avg)
-0.19
Debt to EBITDA (avg)
9.91
Net Debt to Equity (avg)
0.38
Sales to Capital Employed (avg)
3.22
Tax Ratio
10.13%
Dividend Payout Ratio
0
Pledged Shares
0
Institutional Holding
0.00%
ROCE (avg)
0.55%
ROE (avg)
3.42%

Valuation key factors

Factor
Value
P/E Ratio
NA (Loss Making)
Industry P/E
68
Price to Book Value
8.30
EV to EBIT
-88.77
EV to EBITDA
-367.50
EV to Capital Employed
6.28
EV to Sales
3.52
PEG Ratio
NA
Dividend Yield
NA
ROCE (Latest)
-3.18%
ROE (Latest)
-7.96%

Technicals key factors

Indicator
Weekly
Monthly
MACD
Mildly Bearish
Bullish
RSI
No Signal
No Signal
Bollinger Bands
Sideways
Mildly Bullish
Moving Averages
Mildly Bullish (Daily)
KST
Mildly Bearish
Mildly Bearish
Dow Theory
Mildly Bearish
No Trend
stock-summary Technical Indicator Scale: Bearish, Mildly Bearish, Sideways, Mildly Bullish, Bullish  Turned 
stock-summaryShareholding
Shareholding Snapshot : Dec 2025stock-summary
Shareholding Compare (%holding) stock-summary
Majority shareholders

Non Institution

Pledged Promoter Holdings

None

Mutual Funds

Held by 0 Schemes

FIIs

Held by 0 FIIs

Promoter with highest holding

Jayesh Ramniklal Mehta (24.34%)

Highest Public shareholder

Mangal Keshav Capital Limited (17.6%)

Individual Investors Holdings

36.83%

stock-summaryFinancial
[
  {
    "link": "quarterly",
    "btn_text": "All Quarterly Results",
    "header": "Quarterly Results Snapshot (Standalone) - Dec'25 - QoQ",
    "rhs": [
      {
        "prefix": "Net Sales ",
        "suffix": "QoQ Growth in quarter ended Dec 2025 is -35.47% vs -69.44% in Sep 2025",
        "dir": 1
      },
      {
        "prefix": "Standalone Net Profit ",
        "suffix": "QoQ Growth in quarter ended Dec 2025 is 41.67% vs -17.39% in Sep 2025",
        "dir": 1
      }
    ],
    "table": {
      "header": [
        "Dec'25",
        "Sep'25",
        "Change(%)"
      ],
      "body": [
        {
          "field": "Net Sales",
          "val1": "6.64",
          "val2": "10.29",
          "chgp": "-35.47%",
          "chgp_class": "negative"
        },
        {
          "field": "Operating Profit (PBDIT) excl Other Income",
          "val1": "-0.27",
          "val2": "0.14",
          "chgp": "-292.86%",
          "chgp_class": "negative"
        },
        {
          "field": "Interest",
          "val1": "0.57",
          "val2": "0.58",
          "chgp": "-1.72%",
          "chgp_class": "positive"
        },
        {
          "field": "Exceptional Items",
          "val1": "0.00",
          "val2": "0.00",
          "chgp": "",
          "chgp_class": "neutral"
        },
        {
          "field": "Standalone Net Profit",
          "val1": "-0.63",
          "val2": "-1.08",
          "chgp": "41.67%",
          "chgp_class": "positive"
        },
        {
          "field": "Operating Profit Margin (Excl OI)",
          "val1": "-4.07%",
          "val2": "1.36%",
          "chgp": "-5.43%",
          "chgp_class": "negative"
        }
      ]
    }
  },
  {
    "link": "half-yearly",
    "btn_text": "All Half Yearly Results",
    "header": "Half Yearly Results Snapshot (Standalone) - Sep'25",
    "rhs": [
      {
        "prefix": "Net Sales ",
        "suffix": " Growth in half year ended Sep 2025 is -49.96% vs -10.87% in Sep 2024",
        "dir": -1
      },
      {
        "prefix": "Standalone Net Profit ",
        "suffix": " Growth in half year ended Sep 2025 is -276.99% vs 389.74% in Sep 2024",
        "dir": -1
      }
    ],
    "table": {
      "header": [
        "Sep'25",
        "Sep'24",
        "Change(%)"
      ],
      "body": [
        {
          "field": "Net Sales",
          "val1": "43.96",
          "val2": "87.85",
          "chgp": "-49.96%",
          "chgp_class": "negative"
        },
        {
          "field": "Operating Profit (PBDIT) excl Other Income",
          "val1": "0.14",
          "val2": "4.28",
          "chgp": "-96.73%",
          "chgp_class": "negative"
        },
        {
          "field": "Interest",
          "val1": "1.19",
          "val2": "1.51",
          "chgp": "-21.19%",
          "chgp_class": "positive"
        },
        {
          "field": "Exceptional Items",
          "val1": "0.00",
          "val2": "0.00",
          "chgp": "",
          "chgp_class": "neutral"
        },
        {
          "field": "Standalone Net Profit",
          "val1": "-2.00",
          "val2": "1.13",
          "chgp": "-276.99%",
          "chgp_class": "negative"
        },
        {
          "field": "Operating Profit Margin (Excl OI)",
          "val1": "0.32%",
          "val2": "4.87%",
          "chgp": "-4.55%",
          "chgp_class": "negative"
        }
      ]
    }
  },
  {
    "link": "nine-monthly",
    "btn_text": "All Nine Monthly Results",
    "header": "Nine Monthly Results Snapshot (Standalone) - Dec'25",
    "rhs": [
      {
        "prefix": "Net Sales ",
        "suffix": "YoY Growth in nine months ended Dec 2025 is -62.32% vs -5.81% in Dec 2024",
        "dir": -1
      },
      {
        "prefix": "Standalone Net Profit ",
        "suffix": "YoY Growth in nine months ended Dec 2025 is -286.52% vs 254.95% in Dec 2024",
        "dir": -1
      }
    ],
    "table": {
      "header": [
        "Dec'25",
        "Dec'24",
        "Change(%)"
      ],
      "body": [
        {
          "field": "Net Sales",
          "val1": "50.60",
          "val2": "134.28",
          "chgp": "-62.32%",
          "chgp_class": "negative"
        },
        {
          "field": "Operating Profit (PBDIT) excl Other Income",
          "val1": "-0.13",
          "val2": "6.22",
          "chgp": "-102.09%",
          "chgp_class": "negative"
        },
        {
          "field": "Interest",
          "val1": "1.76",
          "val2": "2.26",
          "chgp": "-22.12%",
          "chgp_class": "positive"
        },
        {
          "field": "Exceptional Items",
          "val1": "0.00",
          "val2": "0.00",
          "chgp": "",
          "chgp_class": "neutral"
        },
        {
          "field": "Standalone Net Profit",
          "val1": "-2.63",
          "val2": "1.41",
          "chgp": "-286.52%",
          "chgp_class": "negative"
        },
        {
          "field": "Operating Profit Margin (Excl OI)",
          "val1": "-0.26%",
          "val2": "4.63%",
          "chgp": "-4.89%",
          "chgp_class": "negative"
        }
      ]
    }
  },
  {
    "link": "annual",
    "btn_text": "All Annual Results",
    "header": "Annual Results Snapshot (Standalone) - Mar'25",
    "rhs": [
      {
        "prefix": "Net Sales ",
        "suffix": "YoY Growth in year ended Mar 2025 is 1.82% vs 209.79% in Mar 2024",
        "dir": -1
      },
      {
        "prefix": "Standalone Net Profit ",
        "suffix": "YoY Growth in year ended Mar 2025 is 163.21% vs -146.09% in Mar 2024",
        "dir": 1
      }
    ],
    "table": {
      "header": [
        "Mar'25",
        "Mar'24",
        "Change(%)"
      ],
      "body": [
        {
          "field": "Net Sales",
          "val1": "188.10",
          "val2": "184.73",
          "chgp": "1.82%",
          "chgp_class": "positive"
        },
        {
          "field": "Operating Profit (PBDIT) excl Other Income",
          "val1": "6.26",
          "val2": "2.12",
          "chgp": "195.28%",
          "chgp_class": "positive"
        },
        {
          "field": "Interest",
          "val1": "2.89",
          "val2": "2.60",
          "chgp": "11.15%",
          "chgp_class": "negative"
        },
        {
          "field": "Exceptional Items",
          "val1": "0.00",
          "val2": "0.00",
          "chgp": "",
          "chgp_class": "neutral"
        },
        {
          "field": "Standalone Net Profit",
          "val1": "0.67",
          "val2": "-1.06",
          "chgp": "163.21%",
          "chgp_class": "positive"
        },
        {
          "field": "Operating Profit Margin (Excl OI)",
          "val1": "3.33%",
          "val2": "1.15%",
          "chgp": "2.18%",
          "chgp_class": "positive"
        }
      ]
    }
  }
]

Quarterly Results Snapshot (Standalone) - Dec'25 - QoQstock-summary

Dec'25
Sep'25
Change(%)
Net Sales
6.64
10.29
-35.47%
Operating Profit (PBDIT) excl Other Income
-0.27
0.14
-292.86%
Interest
0.57
0.58
-1.72%
Exceptional Items
0.00
0.00
Standalone Net Profit
-0.63
-1.08
41.67%
Operating Profit Margin (Excl OI)
-4.07%
1.36%
-5.43%
Values in Rs Cr.
Direction Arrows
Net Sales

QoQ Growth in quarter ended Dec 2025 is -35.47% vs -69.44% in Sep 2025

Direction Arrows
Standalone Net Profit

QoQ Growth in quarter ended Dec 2025 is 41.67% vs -17.39% in Sep 2025

Half Yearly Results Snapshot (Standalone) - Sep'25stock-summary

Sep'25
Sep'24
Change(%)
Net Sales
43.96
87.85
-49.96%
Operating Profit (PBDIT) excl Other Income
0.14
4.28
-96.73%
Interest
1.19
1.51
-21.19%
Exceptional Items
0.00
0.00
Standalone Net Profit
-2.00
1.13
-276.99%
Operating Profit Margin (Excl OI)
0.32%
4.87%
-4.55%
Values in Rs Cr.
Direction Arrows
Net Sales

Growth in half year ended Sep 2025 is -49.96% vs -10.87% in Sep 2024

Direction Arrows
Standalone Net Profit

Growth in half year ended Sep 2025 is -276.99% vs 389.74% in Sep 2024

Nine Monthly Results Snapshot (Standalone) - Dec'25stock-summary

Dec'25
Dec'24
Change(%)
Net Sales
50.60
134.28
-62.32%
Operating Profit (PBDIT) excl Other Income
-0.13
6.22
-102.09%
Interest
1.76
2.26
-22.12%
Exceptional Items
0.00
0.00
Standalone Net Profit
-2.63
1.41
-286.52%
Operating Profit Margin (Excl OI)
-0.26%
4.63%
-4.89%
Values in Rs Cr.
Direction Arrows
Net Sales

YoY Growth in nine months ended Dec 2025 is -62.32% vs -5.81% in Dec 2024

Direction Arrows
Standalone Net Profit

YoY Growth in nine months ended Dec 2025 is -286.52% vs 254.95% in Dec 2024

Annual Results Snapshot (Standalone) - Mar'25stock-summary

Mar'25
Mar'24
Change(%)
Net Sales
188.10
184.73
1.82%
Operating Profit (PBDIT) excl Other Income
6.26
2.12
195.28%
Interest
2.89
2.60
11.15%
Exceptional Items
0.00
0.00
Standalone Net Profit
0.67
-1.06
163.21%
Operating Profit Margin (Excl OI)
3.33%
1.15%
2.18%
Values in Rs Cr.
Direction Arrows
Net Sales

YoY Growth in year ended Mar 2025 is 1.82% vs 209.79% in Mar 2024

Direction Arrows
Standalone Net Profit

YoY Growth in year ended Mar 2025 is 163.21% vs -146.09% in Mar 2024

stock-summaryCompany CV
About Candour Techtex Ltd stock-summary
stock-summary
Candour Techtex Ltd
Micro Cap
Plastic Products - Industrial
Candour Techtex Limited was initially incorporated as Amita Texturisers Private Limited on June 17, 1986. Thereafter, the name of the Company was changed to Chandni Engineering Private Limited. The Company became a public limited company and the name of the Company was changed to Chandni Engineering Limited on January 4, 1990 and again to Chandni Textiles Limited on October 14, 2005.
Company Coordinates stock-summary
Company Details
110 TV Industrial Estate, 52 S K Ahire Marg Worli Mumbai Maharashtra : 400030
stock-summary
Tel: 91-09324802991
stock-summary
jrgroup@jrmehta.com
Registrar Details
Purva Shareregistry (India) Pvt Ltd , Gala No 9, Shiv Shakti, Industrial Estate,Sitaram Mill Comp., J R Boricha Marg, Lower Parel [E], Mumbai