
Compare Capacit'e Infra. with Similar Stocks
Stock DNA
Construction
INR 1,841 Cr (Small Cap)
10.00
32
0.00%
0.17
10.03%
0.94
Total Returns (Price + Dividend) 
Latest dividend: 1 per share ex-dividend date: Aug-20-2019
Risk Adjusted Returns v/s
Returns Beta

News

Capacite Infraprojects Ltd is Rated Sell
Capacite Infraprojects Ltd is rated Sell by MarketsMOJO, with this rating last updated on 01 June 2026. However, the analysis and financial metrics discussed here reflect the stock's current position as of 10 June 2026, providing investors with the latest insights into the company’s performance and outlook.
Read full news article
Capacite Infraprojects Ltd Faces Bearish Momentum Amid Technical Downgrade
Capacite Infraprojects Ltd, a small-cap player in the construction sector, has experienced a notable shift in its technical momentum, prompting a downgrade in its Mojo Grade from Hold to Sell as of 1 June 2026. The stock’s recent price action and technical indicators signal a bearish trend, reflecting growing investor caution amid broader market pressures and sectoral challenges.
Read full news article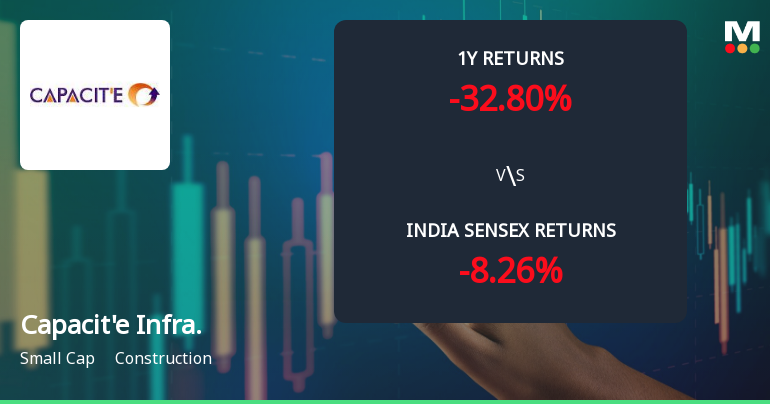
Capacite Infraprojects Ltd Technical Momentum Shifts Amid Bearish Trends
Capacite Infraprojects Ltd, a small-cap player in the construction sector, has experienced a nuanced shift in its technical momentum, reflecting a complex interplay of bullish and bearish indicators. Despite a modest day gain of 1.59%, the stock’s broader technical landscape reveals a transition from bearish to mildly bearish trends, prompting a reassessment of its near-term outlook.
Read full news article Announcements
Receipt Of Letter Of Intent Of ~?589 Crore From Ten X Realty East Limited (A Subsidiary Of Raymond Realty Limited)
03-Jun-2026 | Source : BSEReceipt of Letter of intent of Rs.589 crores from Ten X Realty East Limited (A subsidiary of Raymond Realty Limited)
Compliances-Reg.24(A)-Annual Secretarial Compliance
30-May-2026 | Source : BSEAnnual Secretarial Compliance Report FY 2025-26
Announcement under Regulation 30 (LODR)-Earnings Call Transcript
25-May-2026 | Source : BSETranscript of Earnings Call Q4 FY26
Corporate Actions

No Upcoming Board Meetings

Capacite Infraprojects Ltd has declared 10% dividend, ex-date: 20 Aug 19

No Splits history available

No Bonus history available

No Rights history available
Quality key factors
Valuation key factors
Technicals key factors
 Technical Indicator Scale: Bearish, Mildly Bearish, Sideways, Mildly Bullish, Bullish Turned
 Shareholding Snapshot : Mar 2026
Shareholding Compare (%holding)
Non Institution
31.8893
Held by 2 Schemes (3.22%)
Held by 60 FIIs (14.96%)
Katyal Merchandise Private Limited (10.72%)
Mukul Mahavir Agrawal (6.62%)
36.04%
Quarterly Results Snapshot (Consolidated) - Mar'26 - YoY

YoY Growth in quarter ended Mar 2026 is 6.03% vs 12.09% in Mar 2025
YoY Growth in quarter ended Mar 2026 is -11.04% vs 1.49% in Mar 2025
Half Yearly Results Snapshot (Consolidated) - Sep'25
Growth in half year ended Sep 2025 is 13.59% vs 27.66% in Sep 2024
Growth in half year ended Sep 2025 is -3.30% vs 151.89% in Sep 2024
Nine Monthly Results Snapshot (Consolidated) - Dec'25
YoY Growth in nine months ended Dec 2025 is 13.87% vs 25.92% in Dec 2024
YoY Growth in nine months ended Dec 2025 is -3.49% vs 119.21% in Dec 2024
Annual Results Snapshot (Consolidated) - Mar'26
YoY Growth in year ended Mar 2026 is 11.63% vs 21.63% in Mar 2025
YoY Growth in year ended Mar 2026 is -5.45% vs 68.41% in Mar 2025
About Capacite Infraprojects Ltd

Company Coordinates


