
Compare SPML Infra with Similar Stocks
Dashboard
High Debt company with Weak Long Term Fundamental Strength
- Poor long term growth as Net Sales has grown by an annual rate of 4.87% over the last 5 years
- High Debt Company with a Debt to Equity ratio (avg) of 2.34 times
- The company has been able to generate a Return on Equity (avg) of 2.86% signifying low profitability per unit of shareholders funds
Underperformed the market in the last 1 year
Total Returns (Price + Dividend) 
Latest dividend: 0.5 per share ex-dividend date: Sep-26-2011
Risk Adjusted Returns v/s
Returns Beta

News
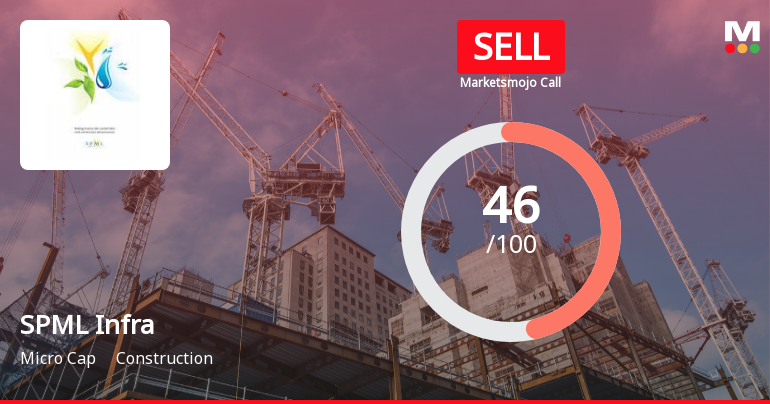
SPML Infra Ltd Downgraded to Sell Amid Mixed Financials and Weak Technicals
SPML Infra Ltd, a micro-cap player in the construction sector, has seen its investment rating downgraded from Hold to Sell as of 28 July 2026. This decision follows a comprehensive reassessment across four key parameters: quality, valuation, financial trend, and technicals. Despite some recent positive financial results, the overall outlook has weakened, prompting a cautious stance from analysts.
Read full news article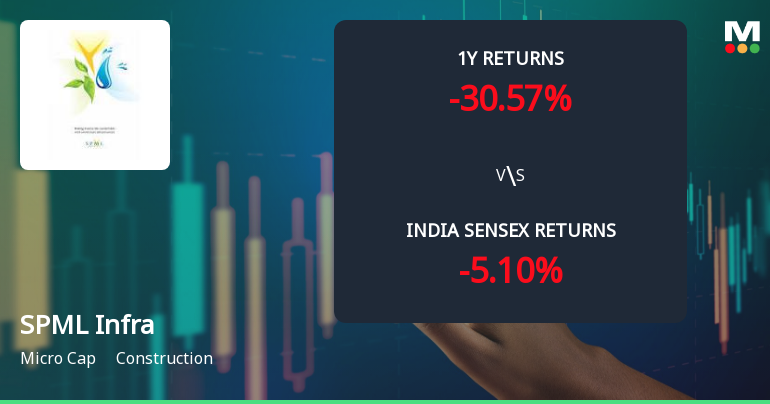
SPML Infra Ltd Technical Momentum Shifts Amid Bearish Signals
SPML Infra Ltd, a micro-cap player in the construction sector, has experienced a notable shift in its technical momentum, with key indicators signalling a transition from mildly bullish to sideways and bearish trends. The stock’s recent price action and technical readings suggest caution for investors amid weakening momentum and a downgrade in its overall rating.
Read full news article
SPML Infra Ltd is Rated Hold by MarketsMOJO
SPML Infra Ltd is rated 'Hold' by MarketsMOJO, with this rating last updated on 15 Jul 2026. However, the analysis and financial metrics discussed here reflect the company’s current position as of 27 July 2026, providing investors with the latest insights into its performance and outlook.
Read full news article Announcements
Shareholder Meeting / Postal Ballot-Notice of Postal Ballot
27-Jul-2026 | Source : BSEIntimation of Postal Ballot notice
Announcement under Regulation 30 (LODR)-Credit Rating
23-Jul-2026 | Source : BSEAssignment and Reaffirmation of Credit Rating
Announcement under Regulation 30 (LODR)-Allotment
18-Jul-2026 | Source : BSEIntimation for allotment of 693999 Equity shares and 9539449 warrants
Corporate Actions

No Upcoming Board Meetings

SPML Infra Ltd has declared 25% dividend, ex-date: 26 Sep 11

No Splits history available

No Bonus history available

No Rights history available
Quality key factors
Valuation key factors
Technicals key factors
 Technical Indicator Scale: Bearish, Mildly Bearish, Sideways, Mildly Bullish, Bullish Turned
 Shareholding Snapshot : Jun 2026
Shareholding Compare (%holding)
Non Institution
22.8498
Held by 0 Schemes
Held by 16 FIIs (0.33%)
Zoom Industrial Services Ltd (17.35%)
National Asset Reconstruction Company Limited (12.52%)
26.48%
Quarterly Results Snapshot (Consolidated) - Mar'26 - YoY

YoY Growth in quarter ended Mar 2026 is 53.68% vs -59.01% in Mar 2025

YoY Growth in quarter ended Mar 2026 is 126.31% vs 235.40% in Mar 2025
Half Yearly Results Snapshot (Consolidated) - Sep'25
Growth in half year ended Sep 2025 is -13.07% vs -34.71% in Sep 2024
Growth in half year ended Sep 2025 is 4.50% vs 3,189.87% in Sep 2024
Nine Monthly Results Snapshot (Consolidated) - Dec'25
YoY Growth in nine months ended Dec 2025 is -1.68% vs -32.01% in Dec 2024
YoY Growth in nine months ended Dec 2025 is 32.20% vs 1,791.05% in Dec 2024
Annual Results Snapshot (Consolidated) - Mar'26
YoY Growth in year ended Mar 2026 is 11.76% vs -41.09% in Mar 2025
YoY Growth in year ended Mar 2026 is 55.78% vs 787.80% in Mar 2025
About SPML Infra Ltd

Company Coordinates


