
Compare Capillary Tech. with Similar Stocks
Dashboard
Poor Management Efficiency with a low ROE of 0%
- The company has reported losses. Due to this company has reported negative ROE
The company is Net-Debt Free
Healthy long term growth as Net Sales has grown by an annual rate of 0%
With ROE of 2.7, it has a Very Expensive valuation with a 4 Price to Book Value
Reducing Promoter Confidence
Stock DNA
Computers - Software & Consulting
INR 4,168 Cr (Small Cap)
103.00
21
0.00%
-0.42
2.68%
4.09
Total Returns (Price + Dividend) 
Capillary Tech. for the last several years.
Risk Adjusted Returns v/s
Returns Beta

News
When is the next results date for Capillary Technologies India Ltd?
The next results date for Capillary Technologies India Ltd is scheduled for August 4, 2026....
Read full news article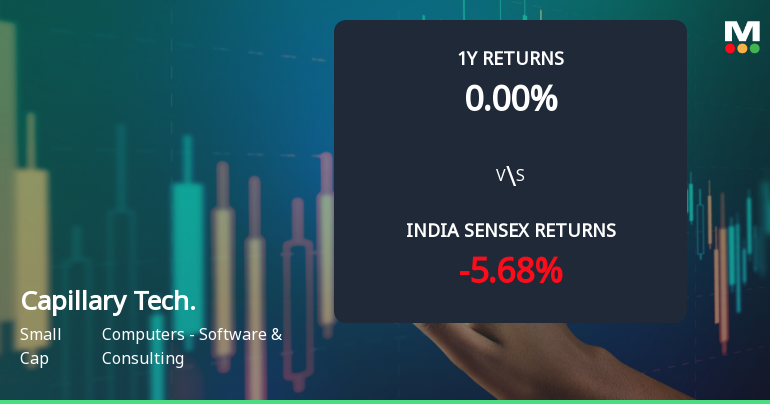
Capillary Technologies India Ltd Sees Technical Momentum Shift Amid Strong Daily Gains
Capillary Technologies India Ltd has experienced a notable shift in its technical momentum, moving from a sideways trend to a mildly bullish stance. This change is underscored by a strong day gain of 12.62%, with key technical indicators such as MACD and Bollinger Bands signalling positive momentum, while the company’s Mojo Grade has improved from Sell to Hold, reflecting a cautiously optimistic outlook for investors.
Read full news article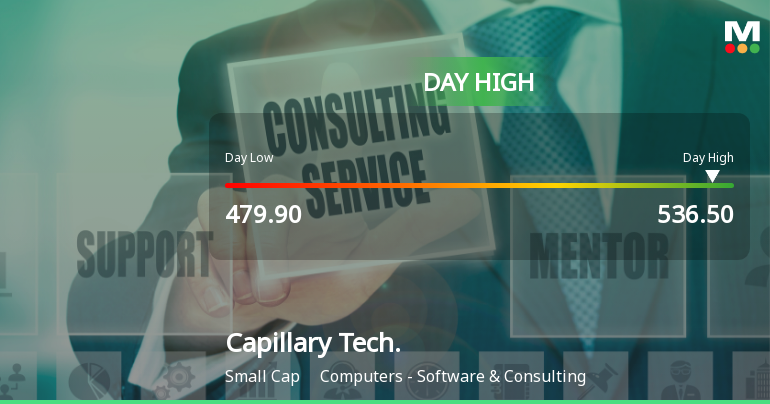
Capillary Technologies India Ltd Surges 10.7% to Day's High of Rs 519.1 — Outperforms Sector by 6.17 Percentage Points
The Sensex advanced 0.88% on 27 Jul 2026, yet Capillary Technologies India Ltd outpaced the broader market with a robust 10.69% gain, reaching an intraday high of Rs 519.1. This 6.17-percentage-point outperformance over the IT - Software sector’s 2.27% rise signals a distinctly stock-specific momentum shift.
Read full news article Announcements
Corporate Actions

04 Aug 2026

No Dividend history available

No Splits history available

No Bonus history available

No Rights history available
Quality key factors
Valuation key factors
Technicals key factors
 Technical Indicator Scale: Bearish, Mildly Bearish, Sideways, Mildly Bullish, Bullish Turned
 Shareholding Snapshot : Jun 2026
Shareholding Compare (%holding)
Promoters
None
Held by 13 Schemes (14.82%)
Held by 17 FIIs (3.34%)
Capillary Technologies International Pte Ltd (48.92%)
Ronal Holdings Llc (6.95%)
4.75%
Quarterly Results Snapshot (Standalone) - Mar'26 - QoQ

QoQ Growth in quarter ended Mar 2026 is 12.14% vs 24.53% in Dec 2025

QoQ Growth in quarter ended Mar 2026 is 842.86% vs 135.71% in Dec 2025
Half Yearly Results Snapshot (Consolidated) - Sep'25
Not Applicable: The company has declared_date for only one period
Not Applicable: The company has declared_date for only one period
Nine Monthly Results Snapshot (Consolidated) - Dec'25
Not Applicable: The company has declared_date for only one period
Not Applicable: The company has declared_date for only one period
Annual Results Snapshot (Consolidated) - Mar'26
YoY Growth in year ended Mar 2026 is 22.79% vs 13.93% in Mar 2025
YoY Growth in year ended Mar 2026 is 294.50% vs 122.36% in Mar 2025
About Capillary Technologies India Ltd

Company Coordinates


