
Compare CARE Ratings with Similar Stocks
Dashboard
The company is Net-Debt Free
Poor long term growth as Net Sales has grown by an annual rate of 13.75% and Operating profit at 15.76% over the last 5 years
The company has declared Positive results for the last 11 consecutive quarters
With ROE of 18.4, it has a Very Expensive valuation with a 5.2 Price to Book Value
High Institutional Holdings at 54.63%
Stock DNA
Capital Markets
INR 4,829 Cr (Small Cap)
29.00
32
0.50%
-0.13
18.36%
5.12
Total Returns (Price + Dividend) 
Latest dividend: 8 per share ex-dividend date: Nov-19-2025
Risk Adjusted Returns v/s
Returns Beta

News
CARE Ratings Ltd Downgraded to Hold Amid Mixed Technical and Valuation Signals
CARE Ratings Ltd, a prominent player in the capital markets sector, has seen its investment rating downgraded from Buy to Hold as of 1 June 2026. This adjustment reflects a nuanced reassessment across four critical parameters: quality, valuation, financial trend, and technicals. While the company continues to demonstrate solid financial performance and operational strength, evolving market dynamics and valuation metrics have prompted a more cautious stance among analysts.
Read full news article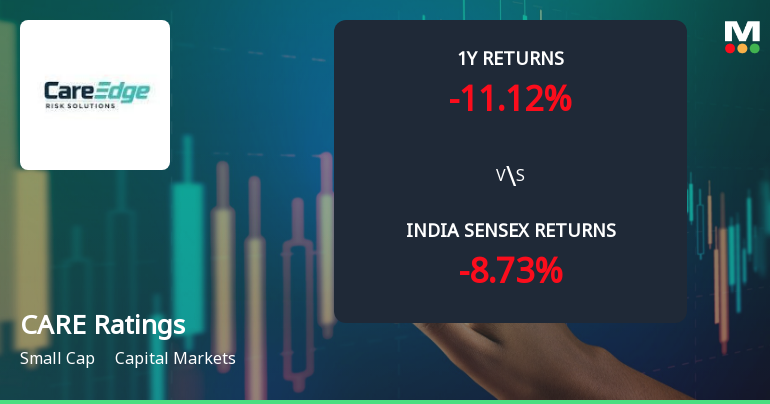
CARE Ratings Ltd Technical Momentum Shifts Amid Mixed Market Signals
CARE Ratings Ltd has experienced a nuanced shift in its technical momentum, moving from a bullish to a mildly bullish stance as of early June 2026. Despite a modest decline in share price, the stock’s technical indicators present a complex picture, reflecting both resilience and caution within the capital markets sector.
Read full news article
CARE Ratings Ltd is Rated Buy by MarketsMOJO
CARE Ratings Ltd is rated Buy by MarketsMOJO. This rating was last updated on 20 May 2026, reflecting a shift from the previous Hold status. However, the analysis and financial metrics discussed here represent the stock's current position as of 01 June 2026, providing investors with the latest insights into the company’s performance and outlook.
Read full news article Announcements
Announcement under Regulation 30 (LODR)-Allotment of ESOP / ESPS
10-Jun-2026 | Source : BSEAllotment of 11250 equity shares pursuant to exercise of ESOP
Announcement under Regulation 30 (LODR)-Newspaper Publication
09-Jun-2026 | Source : BSENewspaper Publication
Announcement under Regulation 30 (LODR)-Newspaper Publication
08-Jun-2026 | Source : BSEIEPF Newspaper Publication
Corporate Actions

No Upcoming Board Meetings

CARE Ratings Ltd has declared 140% dividend, ex-date: 25 Jun 26

No Splits history available

No Bonus history available

No Rights history available
Quality key factors
Valuation key factors
Technicals key factors
 Technical Indicator Scale: Bearish, Mildly Bearish, Sideways, Mildly Bullish, Bullish Turned
 Shareholding Snapshot : Mar 2026
Shareholding Compare (%holding)
Non Institution
None
Held by 9 Schemes (16.95%)
Held by 97 FIIs (23.25%)
None
Life Insurance Corporation Of India (9.55%)
24.94%
Quarterly Results Snapshot (Consolidated) - Mar'26 - YoY

YoY Growth in quarter ended Mar 2026 is 19.17% vs 21.63% in Mar 2025
YoY Growth in quarter ended Mar 2026 is 23.98% vs 76.95% in Mar 2025
Half Yearly Results Snapshot (Consolidated) - Sep'25
Growth in half year ended Sep 2025 is 17.32% vs 20.53% in Sep 2024
Growth in half year ended Sep 2025 is 23.39% vs 26.12% in Sep 2024
Nine Monthly Results Snapshot (Consolidated) - Dec'25
YoY Growth in nine months ended Dec 2025 is 16.99% vs 21.17% in Dec 2024

YoY Growth in nine months ended Dec 2025 is 25.08% vs 23.78% in Dec 2024
Annual Results Snapshot (Consolidated) - Mar'26
YoY Growth in year ended Mar 2026 is 17.59% vs 21.30% in Mar 2025
YoY Growth in year ended Mar 2026 is 24.73% vs 36.53% in Mar 2025
About CARE Ratings Ltd

Company Coordinates


