
Compare CCL Products with Similar Stocks
Dashboard
With a growth in Net Sales of 16.55%, the company declared Very Positive results in Mar 26
- The company has declared positive results for the last 3 consecutive quarters
- ROCE(HY) Highest at 16.07%
- OPERATING PROFIT TO INTEREST(Q) Highest at 6.35 times
- DEBT-EQUITY RATIO(HY) Lowest at 0.57 times
With ROCE of 16.8, it has a Fair valuation with a 4.7 Enterprise value to Capital Employed
High Institutional Holdings at 32.67%
Market Beating performance in long term as well as near term
Total Returns (Price + Dividend) 
Latest dividend: 2.74 per share ex-dividend date: Feb-10-2026
Risk Adjusted Returns v/s
Returns Beta

News
CCL Products Rallies 7.25% to New 52-Week High, Outperforming FMCG Sector by Nearly 4 Percentage Points
The Sensex rose 0.55% on 10 Jun 2026, yet CCL Products (India) Ltd surged 7.25%, touching a fresh 52-week and all-time high of Rs 1,225. This 3.97-percentage-point outperformance over the Tea/Coffee sector’s 2.41% gain highlights a distinctly stock-specific rally rather than a broad market lift.
Read full news article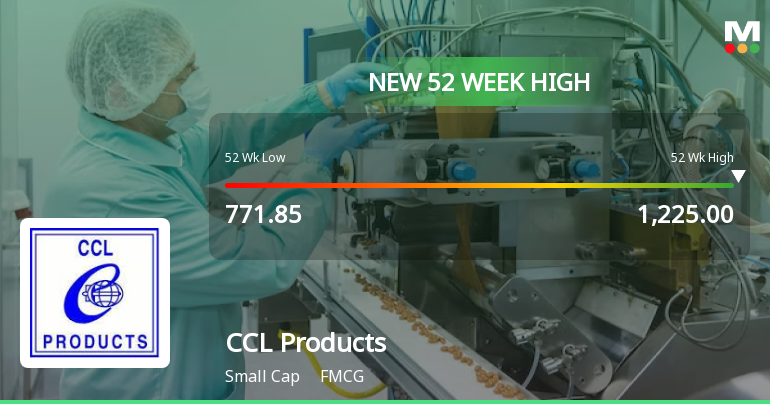
Broad-Based Technical Strength Lifts CCL Products to 52-Week High of Rs 1225
Surging to an intraday peak of Rs 1225 on 10 Jun 2026, CCL Products (India) Ltd has marked a significant milestone by reaching a fresh 52-week high. This achievement comes amid a robust technical backdrop and sustained price momentum that has propelled the stock well ahead of its sector and broader market peers.
Read full news article
Announcements
Announcement under Regulation 30 (LODR)-Analyst / Investor Meet - Intimation
11-Jun-2026 | Source : BSEThis is to inform you that the Company is participating in an investor conference which shall be held on Monday June 15 2026.
Announcement under Regulation 30 (LODR)-Analyst / Investor Meet - Intimation
11-Jun-2026 | Source : BSEThis is to inform you that the Company is participating in a conference call to be held on Tuesday June 16 2026. The details are being attached herewith for your kind perusal.
Reply To Clarification Related To Volume Movement.
09-Jun-2026 | Source : BSEWe hereby submit our clarification relating to the volume movement in reply to your mail dated 09.06.2026
Corporate Actions

No Upcoming Board Meetings

CCL Products (India) Ltd has declared 137% dividend, ex-date: 10 Feb 26

CCL Products (India) Ltd has announced 2:10 stock split, ex-date: 19 Aug 13

CCL Products (India) Ltd has announced 1:1 bonus issue, ex-date: 19 Aug 13

No Rights history available
Quality key factors
Valuation key factors
Technicals key factors
 Technical Indicator Scale: Bearish, Mildly Bearish, Sideways, Mildly Bullish, Bullish Turned
 Shareholding Snapshot : Mar 2026
Shareholding Compare (%holding)
Promoters
None
Held by 30 Schemes (19.02%)
Held by 133 FIIs (11.24%)
Challa Shantha Prasad (24.01%)
Axis Mutual Fund Trustee Limited A/c Axis Mutual Fund A/c Axis Small Cap Fund (5.51%)
10.03%
Quarterly Results Snapshot (Consolidated) - Mar'26 - QoQ

QoQ Growth in quarter ended Mar 2026 is 16.55% vs -6.76% in Dec 2025
QoQ Growth in quarter ended Mar 2026 is 14.22% vs -0.58% in Dec 2025
Half Yearly Results Snapshot (Consolidated) - Sep'25
Growth in half year ended Sep 2025 is 44.39% vs 19.72% in Sep 2024

Growth in half year ended Sep 2025 is 19.18% vs 19.62% in Sep 2024
Nine Monthly Results Snapshot (Consolidated) - Dec'25
YoY Growth in nine months ended Dec 2025 is 42.43% vs 17.80% in Dec 2024
YoY Growth in nine months ended Dec 2025 is 31.24% vs 12.77% in Dec 2024
Annual Results Snapshot (Consolidated) - Mar'26
YoY Growth in year ended Mar 2026 is 43.52% vs 17.03% in Mar 2025
YoY Growth in year ended Mar 2026 is 25.06% vs 24.10% in Mar 2025
About CCL Products (India) Ltd

Company Coordinates


