
Compare CDG Petchem with Similar Stocks
Dashboard
High Debt company with Weak Long Term Fundamental Strength
- Poor long term growth as Net Sales has grown by an annual rate of 10.46% and Operating profit at 7.12% over the last 5 years
- High Debt Company with a Debt to Equity ratio (avg) of 5.48 times
- The company has been able to generate a Return on Equity (avg) of 1.83% signifying low profitability per unit of shareholders funds
The company has declared Negative results for the last 3 consecutive quarters
With ROCE of 25.1, it has a Expensive valuation with a 4.1 Enterprise value to Capital Employed
Stock DNA
Plastic Products - Industrial
INR 239 Cr (Micro Cap)
52.00
35
0.00%
0.21
9.16%
4.57
Total Returns (Price + Dividend) 
CDG Petchem for the last several years.
Risk Adjusted Returns v/s
Returns Beta

News
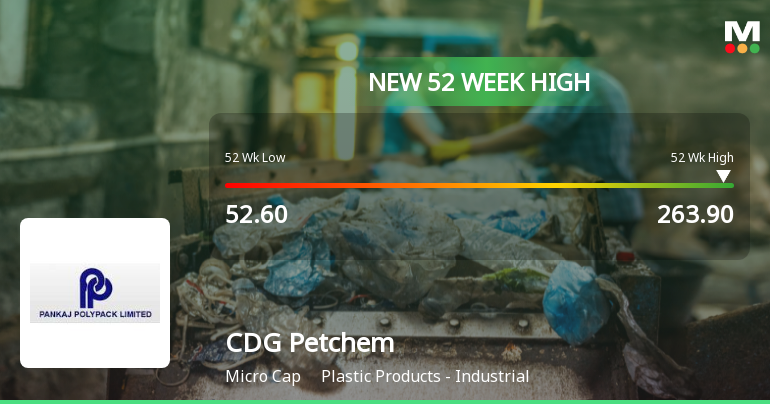
Broad-Based Technical Strength Lifts CDG Petchem Ltd to 52-Week High of Rs 263.9
With a remarkable surge to Rs 263.9 on 11 Jun 2026, CDG Petchem Ltd has reached a fresh 52-week and all-time high, marking a spectacular rally of nearly 400% from its 52-week low of Rs 52.6. This milestone comes amid a backdrop of strong technical momentum despite a broadly weakening market environment.
Read full news article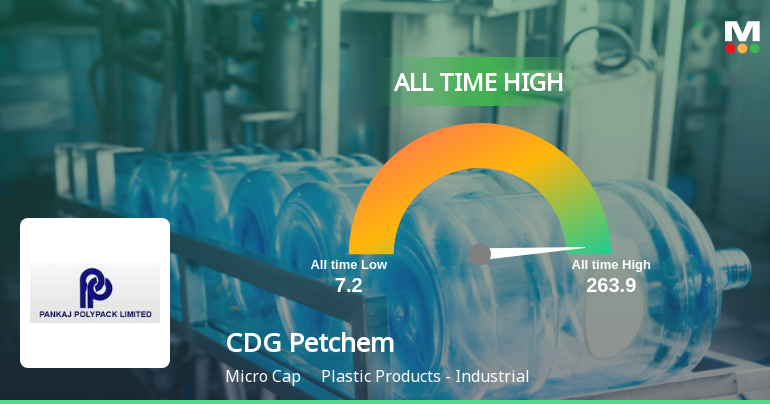
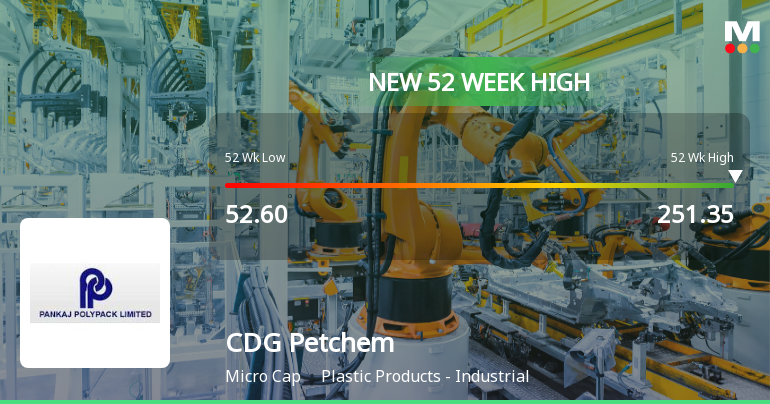
Broad-Based Technical Strength Lifts CDG Petchem Ltd to 52-Week High of Rs 251.35
Surging to an all-time high of Rs 251.35 on 10 Jun 2026, CDG Petchem Ltd has demonstrated remarkable price momentum, outperforming its sector and the broader market with a sustained rally that has extended over 11 consecutive sessions.
Read full news article Announcements
Announcement under Regulation 30 (LODR)-Newspaper Publication
02-Jun-2026 | Source : BSENewspaper Publication for Financial Results.
Announcement under Regulation 30 (LODR)-Press Release / Media Release
01-Jun-2026 | Source : BSEPress Release relating to delivery of stellar Financial performance by CDG Petchem Limited for the FY26.
Board Meeting Outcome for Outcome Of The Meeting Of The Board Of Directors Of CDG PETCHEM LIMITED (The Company) In Terms Of The Provisions Of Regulation 30 Of The Securities And Exchange Board Of India (Listing Obligations And Disclosure Requirements) Reg
30-May-2026 | Source : BSEPursuant to Regulation 30 and Regulation 33 of the SEBI (Listing Obligations and Disclosure Requirements) Regulations 2015 (Listing Regulations) we hereby inform you that the Board of Directors of the Company in its meeting held today i.e. May 30 2026 at 03:00 P.M. through Audio-Visual means has inter-alia considered and approved the following Matters: 1. Audited Financial Results (Standalone) of the Company for the quarter and financial year ended March 31 2026. 2. Audited Financial Results (Consolidated) of the Company for the quarter and financial year ended March 31 2026. 3. Change of Registrar and Share Transfer Agent (RTA) of the Company
Corporate Actions

No Upcoming Board Meetings

No Dividend history available

No Splits history available

No Bonus history available

No Rights history available
Quality key factors
Valuation key factors
Technicals key factors
 Technical Indicator Scale: Bearish, Mildly Bearish, Sideways, Mildly Bullish, Bullish Turned
 Shareholding Snapshot : Mar 2026
Shareholding Compare (%holding)
Promoters
None
Held by 0 Schemes
Held by 0 FIIs
Rajesh Kumar Dugar (3.0%)
Jujhar Construction & Travels Private Limited (70.75%)
13.21%
Quarterly Results Snapshot (Consolidated) - Mar'26 - YoY

YoY Growth in quarter ended Mar 2026 is 894.67% vs -28.38% in Mar 2025
YoY Growth in quarter ended Mar 2026 is 1,239.29% vs 33.33% in Mar 2025
Half Yearly Results Snapshot (Consolidated) - Sep'24

Growth in half year ended Sep 2024 is -44.44% vs -19.34% in Sep 2023
Growth in half year ended Sep 2024 is 0.00% vs 100.00% in Sep 2023
Nine Monthly Results Snapshot (Consolidated) - Dec'24
YoY Growth in nine months ended Dec 2024 is -46.23% vs -10.42% in Dec 2023
YoY Growth in nine months ended Dec 2024 is -60.78% vs -418.75% in Dec 2023
Annual Results Snapshot (Consolidated) - Mar'26
YoY Growth in year ended Mar 2026 is 224.16% vs -43.01% in Mar 2025
YoY Growth in year ended Mar 2026 is 497.30% vs -50.00% in Mar 2025
About CDG Petchem Ltd

Company Coordinates


