
Compare Ceigall India with Similar Stocks
Dashboard
High Management Efficiency with a high ROCE of 17.44%
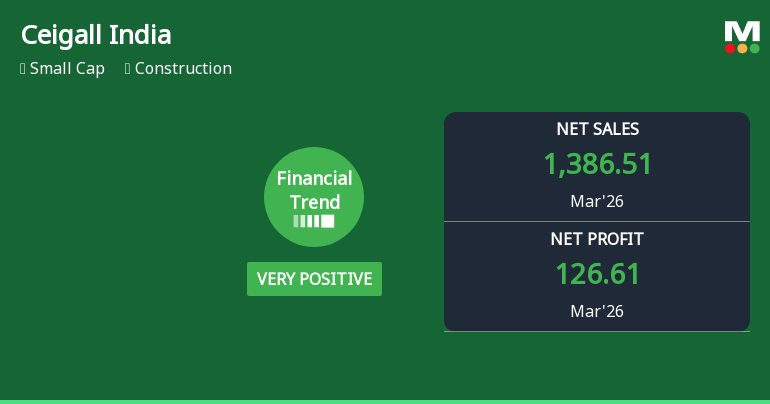
With a growth in Net Profit of 78.24%, the company declared Very Positive results in Mar 26
With ROCE of 17.1, it has a Attractive valuation with a 2.4 Enterprise value to Capital Employed
Increasing Participation by Institutional Investors
Market Beating Performance
Stock DNA
Construction
INR 6,564 Cr (Small Cap)
21.00
32
0.00%
0.44
14.59%
3.01
Total Returns (Price + Dividend) 
Latest dividend: 0.5 per share ex-dividend date: Sep-23-2024
Risk Adjusted Returns v/s
Returns Beta

News
Ceigall India Ltd Reports Strong Quarterly Gains Amid Positive Financial Trend Shift
Ceigall India Ltd, a small-cap player in the construction sector, has demonstrated robust financial performance in the quarter ending March 2026, signalling a positive shift in its financial trend. The company’s latest results reveal record-breaking revenue and profit metrics, alongside improved operational efficiency, marking a significant upgrade from its previous quarter and historical performance.
Read full news article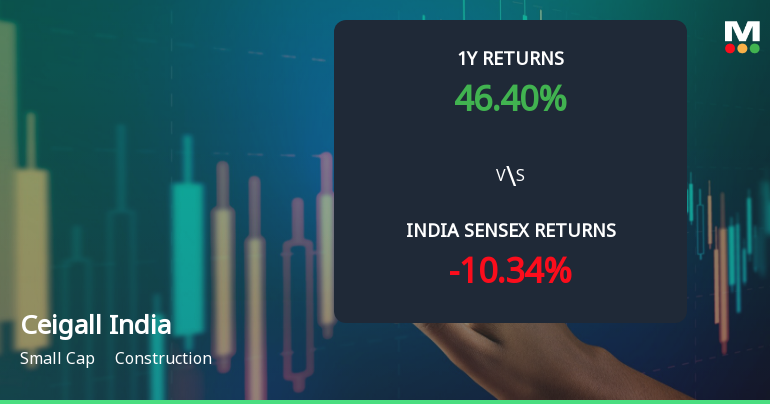
Ceigall India Ltd Shows Renewed Momentum Amid Mixed Technical Signals
Ceigall India Ltd, a small-cap player in the construction sector, has witnessed a notable shift in its technical momentum, reflecting a cautiously optimistic outlook. The stock’s price surged 4.26% on 10 Jun 2026, closing at ₹366.00, signalling renewed investor interest amid mixed technical signals across multiple timeframes.
Read full news article
Ceigall India Ltd is Rated Buy
Ceigall India Ltd is rated 'Buy' by MarketsMOJO, with this rating last updated on 07 May 2026. However, the analysis and financial metrics discussed here reflect the company’s current position as of 08 June 2026, providing investors with the most recent insights into its performance and outlook.
Read full news article Announcements
Intimation For Execution Of The Concession Agreement By The Project SPV.
10-Jun-2026 | Source : BSEIn continuation to our earlier letter dated 23rd April 2026 and 27th March 2026 and pursuant to the Regulation 30 of the SEBI (Listing Obligations and Disclosure Requirements) Regulation 2015 we are pleased to inform that CEIGALL AMBALA CHANDIGARH ZIRAKPUR LIMITED Project Special Purpose Vehicle (SPV) has executed the Concession Agreement with the National Highways Authority of India on 09th June 2026
Announcement under Regulation 30 (LODR)-Press Release / Media Release
04-Jun-2026 | Source : BSEIn continuation of our letter dated 04 June 2026 and pursuant to Regulation 30 of the SEBI (Listing Obligations and Disclosure Requirements) Regulations 2015 please find enclosed the press release titled Ceigall India Signs Definitive Pact with Neo Infra Fund for CMASH Divestment.
Intimation Of Execution Of Share Purchase Agreement
04-Jun-2026 | Source : BSEIn continuation of our earlier letter dated 9th February 2026 and pursuant to Regulation 30 of the SEBI (Listing Obligations and Disclosure Requirements) Regulations 2015 we wish to inform you that in respect of the Project Company Ceigall Malout Abohar Sadhuwali Highways Private Limited a step-down subsidiary of Ceigall India Limited held through Ceigall Infra Projects Private Limited a wholly owned subsidiary of Ceigall India Limited (collectively referred to as the Sellers) the Sellers have entered into a Share Purchase Agreement (SPA) on 3rd June 2026 with Neo Infra Income Opportunity Fund managed by Neo Alternative Asset Managers Private Limited (the Purchaser).
Corporate Actions

No Upcoming Board Meetings

Ceigall India Ltd has declared 10% dividend, ex-date: 23 Sep 24

No Splits history available

No Bonus history available

No Rights history available
Quality key factors
Valuation key factors
Technicals key factors
 Technical Indicator Scale: Bearish, Mildly Bearish, Sideways, Mildly Bullish, Bullish Turned
 Shareholding Snapshot : Mar 2026
Shareholding Compare (%holding)
Promoters
None
Held by 4 Schemes (1.58%)
Held by 26 FIIs (3.14%)
Ramneek Sehgal And Sons Huf . (37.28%)
Icici Prudential Life Insurance Company Limited (3.71%)
7.12%
Quarterly Results Snapshot (Consolidated) - Mar'26 - QoQ

QoQ Growth in quarter ended Mar 2026 is 39.89% vs 22.88% in Dec 2025
QoQ Growth in quarter ended Mar 2026 is 70.84% vs 27.80% in Dec 2025
Half Yearly Results Snapshot (Consolidated) - Sep'25

Growth in half year ended Sep 2025 is 3.15% vs 14.64% in Sep 2024
Growth in half year ended Sep 2025 is -24.23% vs 24.33% in Sep 2024
Nine Monthly Results Snapshot (Consolidated) - Dec'25
YoY Growth in nine months ended Dec 2025 is 8.69% vs 16.27% in Dec 2024
YoY Growth in nine months ended Dec 2025 is -15.75% vs 11.53% in Dec 2024
Annual Results Snapshot (Consolidated) - Mar'26
YoY Growth in year ended Mar 2026 is 17.04% vs 13.45% in Mar 2025
YoY Growth in year ended Mar 2026 is 6.08% vs -3.96% in Mar 2025
About Ceigall India Ltd

Company Coordinates


