
Compare Cemindia Project with Similar Stocks
Dashboard
High Management Efficiency with a high ROCE of 28.97%
Company has a Debt to Equity ratio (avg) of 0.03 times
Healthy long term growth as Net Sales has grown by an annual rate of 29.74% and Operating profit at 49.65%
With a growth in Net Profit of 118.39%, the company declared Very Positive results in Mar 26
With ROE of 24.9, it has a Attractive valuation with a 8.1 Price to Book Value
Stock DNA
Construction
INR 20,109 Cr (Small Cap)
33.00
43
0.17%
-0.02
24.92%
8.42
Total Returns (Price + Dividend) 
Latest dividend: 3 per share ex-dividend date: Jun-12-2026
Risk Adjusted Returns v/s
Returns Beta

News
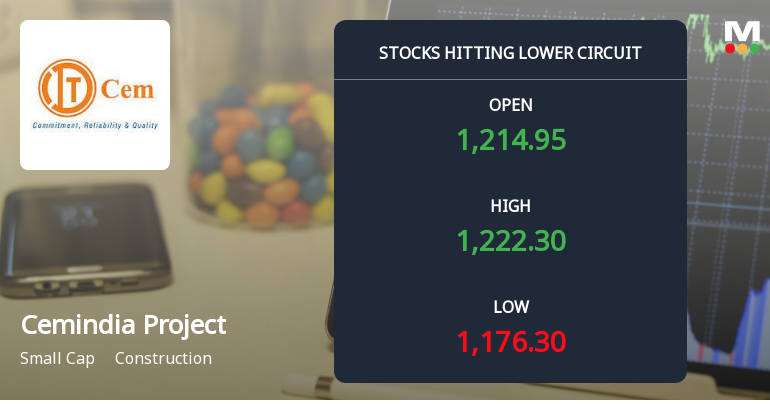
Below All Moving Averages and Now at Lower Circuit: Cemindia Projects Ltd Loses 3.5% in a Single Session
At Rs 1,175.3, sellers were still queuing — but there were no buyers willing to take the other side. Cemindia Projects Ltd locked at its lower circuit of 5% on 11 Jun 2026, with unfilled sell orders and a frozen price, signalling persistent selling pressure in a small-cap construction stock.
Read full news article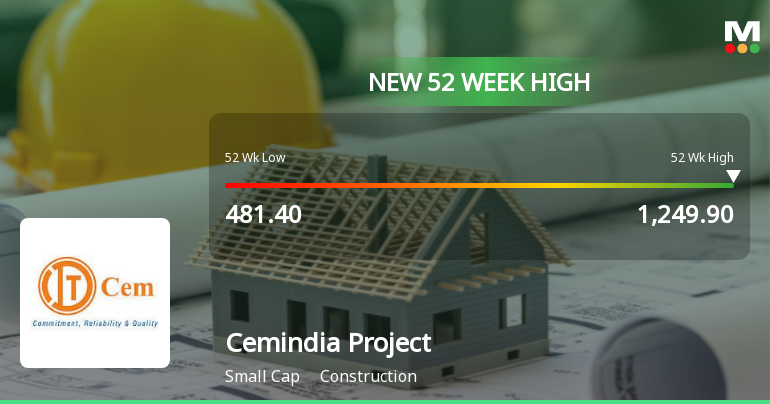
Broad-Based Technical Strength Lifts Cemindia Projects Ltd to 52-Week High of Rs 1249.9
With a decisive surge to Rs 1249.9 on 10 Jun 2026, Cemindia Projects Ltd has reached a new 52-week and all-time high, marking a remarkable 54.84% gain over the past year. This rally is underpinned by a confluence of strong technical indicators and sustained price momentum, setting the stock apart in the construction sector despite a broadly cautious market backdrop.
Read full news article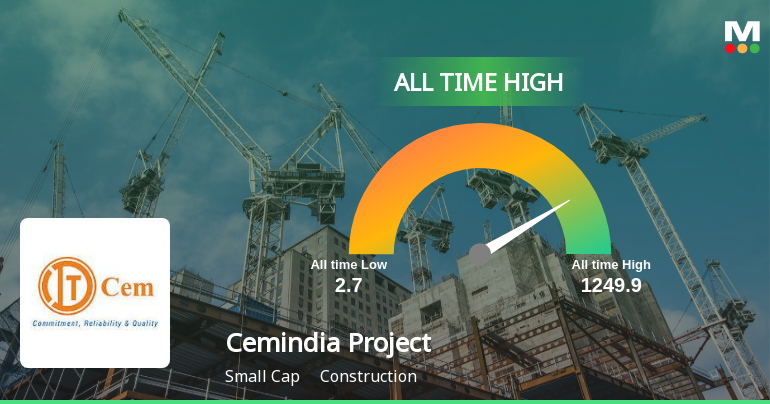
Cemindia Projects Ltd Hits All-Time High of Rs 1249.9 as Momentum Builds Across Timeframes
Extending its winning streak to two sessions, Cemindia Projects Ltd surged to a fresh all-time high of Rs 1249.9 on 10 Jun 2026, outperforming its sector and the broader market with notable volatility and strong technical signals.
Read full news article Announcements
Intimation Regarding Change In Name Of Promoter Entities Under Regulation 30 Of SEBI (Listing Obligations And Disclosure Requirements) Regulations 2015 (SEBI Listing Regulations)
03-Jun-2026 | Source : BSELetter enclosed
Intimation Regarding Change In Name Of Promoter Entities Under Regulation 30 Of SEBI (Listing Obligations And Disclosure Requirements) Regulations 2015 (SEBI Listing Regulations)
03-Jun-2026 | Source : BSELetter enclosed
Announcement under Regulation 30 (LODR)-Newspaper Publication
01-Jun-2026 | Source : BSENewspaper publication
Corporate Actions

No Upcoming Board Meetings

Cemindia Projects Ltd has declared 300% dividend, ex-date: 12 Jun 26

Cemindia Projects Ltd has announced 1:10 stock split, ex-date: 21 Aug 15

No Bonus history available

Cemindia Projects Ltd has announced 1:1 rights issue, ex-date: 30 Oct 07
Quality key factors
Valuation key factors
Technicals key factors
 Technical Indicator Scale: Bearish, Mildly Bearish, Sideways, Mildly Bullish, Bullish Turned
 Shareholding Snapshot : Mar 2026
Shareholding Compare (%holding)
Promoters
None
Held by 18 Schemes (1.41%)
Held by 134 FIIs (7.31%)
Renew Exim Dmcc (67.46%)
Hitesh Ramji Javeri (1.78%)
17.82%
Quarterly Results Snapshot (Consolidated) - Mar'26 - QoQ

QoQ Growth in quarter ended Mar 2026 is 28.42% vs 5.48% in Dec 2025
QoQ Growth in quarter ended Mar 2026 is 118.39% vs 2.97% in Dec 2025
Half Yearly Results Snapshot (Consolidated) - Sep'25

Growth in half year ended Sep 2025 is 7.90% vs 26.99% in Sep 2024
Growth in half year ended Sep 2025 is 42.18% vs 62.74% in Sep 2024
Nine Monthly Results Snapshot (Consolidated) - Dec'25
YoY Growth in nine months ended Dec 2025 is 5.88% vs 21.66% in Dec 2024
YoY Growth in nine months ended Dec 2025 is 37.22% vs 40.74% in Dec 2024
Annual Results Snapshot (Consolidated) - Mar'26
YoY Growth in year ended Mar 2026 is 8.81% vs 19.80% in Mar 2025
YoY Growth in year ended Mar 2026 is 60.34% vs 36.19% in Mar 2025
About Cemindia Projects Ltd

Company Coordinates


