
Compare Century Enka with Similar Stocks
Stock DNA
Garments & Apparels
INR 1,176 Cr (Micro Cap)
11.00
25
1.83%
-0.23
6.83%
0.80
Total Returns (Price + Dividend) 
Latest dividend: 9.953093812375249 per share ex-dividend date: Aug-05-2025
Risk Adjusted Returns v/s
Returns Beta

News

Century Enka Ltd Upgraded to Buy on Strong Financial and Technical Momentum
Century Enka Ltd, a micro-cap player in the Garments & Apparels sector, has seen its investment rating upgraded from Hold to Buy following a comprehensive reassessment of its quality, valuation, financial trends, and technical indicators. The upgrade reflects the company’s robust quarterly financial results, improved technical outlook, and attractive valuation metrics despite some long-term growth concerns.
Read full news article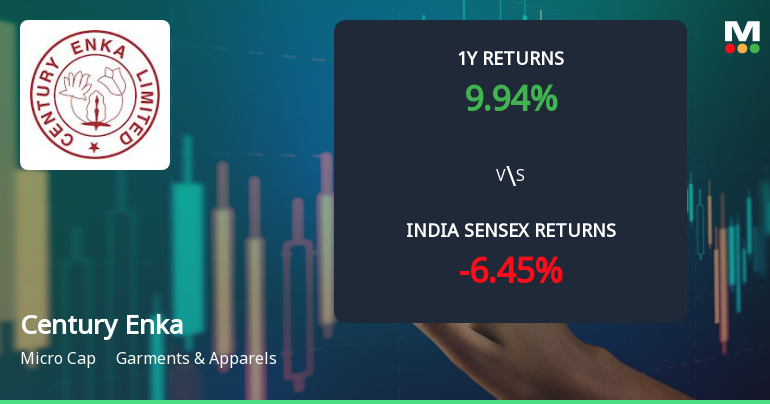
Century Enka Ltd Technical Momentum Shifts Signal Bullish Outlook
Century Enka Ltd has witnessed a notable shift in its technical momentum, with key indicators signalling an upgrade from mildly bullish to bullish. This change is underscored by strong price action, improved moving averages, and positive MACD readings, suggesting a favourable outlook for investors in the garments and apparels sector.
Read full news article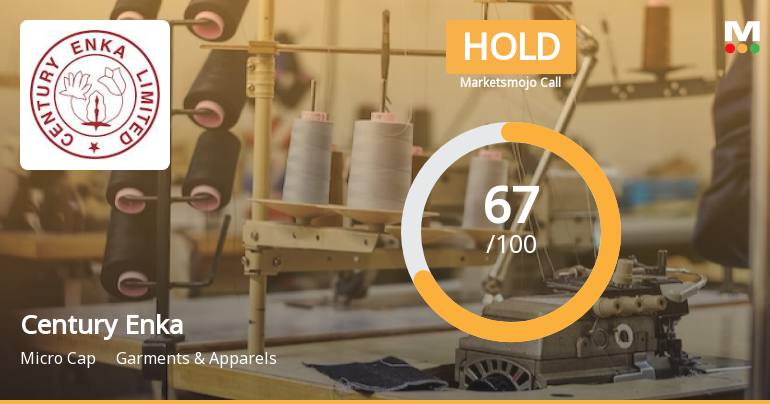
Century Enka Ltd is Rated Hold by MarketsMOJO
Century Enka Ltd is rated 'Hold' by MarketsMOJO, with this rating last updated on 15 Apr 2026. However, the analysis and financial metrics discussed here reflect the company’s current position as of 21 June 2026, providing investors with the most recent insights into its performance and outlook.
Read full news article Announcements
Revised Intimation Of Execution Of Power Purchase Agreement
22-Jun-2026 | Source : BSERevised Intimation of Execution of Power Purchase Agreement.
Execution Of Power Purchase Agreement
20-Jun-2026 | Source : BSECentury Enka Limited has entered into a Power Purchase Agreement with ABREL Century Energy Limited a Special Purpose Vehicle.
Announcement under Regulation 30 (LODR)-Earnings Call Transcript
27-May-2026 | Source : BSETranscript of Earnings Conference Call for Q4-FY26/FY26 attached.
Corporate Actions

No Upcoming Board Meetings

Century Enka Ltd has declared 100% dividend, ex-date: 05 Aug 25

No Splits history available

No Bonus history available

No Rights history available
Quality key factors
Valuation key factors
Technicals key factors
 Technical Indicator Scale: Bearish, Mildly Bearish, Sideways, Mildly Bullish, Bullish Turned
 Shareholding Snapshot : Mar 2026
Shareholding Compare (%holding)
Non Institution
None
Held by 6 Schemes (9.98%)
Held by 39 FIIs (2.06%)
Birla Group Holdings Private Limited (16.63%)
Quant Mutual Fund - Quant Multi Cap Fund (7.87%)
44.78%
Quarterly Results Snapshot (Consolidated) - Mar'26 - QoQ

QoQ Growth in quarter ended Mar 2026 is 17.46% vs 0.72% in Dec 2025
QoQ Growth in quarter ended Mar 2026 is 66.03% vs 6.27% in Dec 2025
Half Yearly Results Snapshot (Consolidated) - Sep'25

Growth in half year ended Sep 2025 is -23.87% vs 29.02% in Sep 2024
Growth in half year ended Sep 2025 is -17.52% vs 156.71% in Sep 2024
Nine Monthly Results Snapshot (Consolidated) - Dec'25
YoY Growth in nine months ended Dec 2025 is -21.56% vs 22.13% in Dec 2024
YoY Growth in nine months ended Dec 2025 is 2.90% vs 165.61% in Dec 2024
Annual Results Snapshot (Consolidated) - Mar'26
YoY Growth in year ended Mar 2026 is -14.80% vs 14.77% in Mar 2025
YoY Growth in year ended Mar 2026 is 51.71% vs 55.49% in Mar 2025
About Century Enka Ltd

Company Coordinates


