
Compare CG Power & Ind with Similar Stocks
Dashboard
Strong Long Term Fundamental Strength with an average Return on Equity (ROE) of 32.05%
- Healthy long term growth as Net Sales has grown by an annual rate of 28.56% and Operating profit at 47.47%
- The company is Net-Debt Free
Flat results in Jun 26
With ROE of 15.4, it has a Very Expensive valuation with a 16.5 Price to Book Value
High Institutional Holdings at 30.27%
Market Beating performance in long term as well as near term
Stock DNA
Heavy Electrical Equipment
INR 136,821 Cr (Large Cap)
103.00
NA
0.16%
-0.16
15.45%
16.45
Total Returns (Price + Dividend) 
Latest dividend: 1.3 per share ex-dividend date: Jan-30-2026
Risk Adjusted Returns v/s
Returns Beta

News
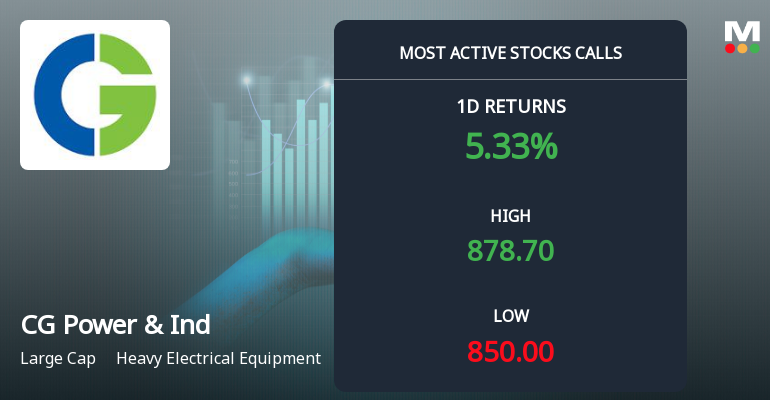
Rs 900 Calls on CG Power & Industrial Solutions Ltd See Heavy Activity — What the Strike Price Tells You
On 31 Jul 2026, 4,618 call contracts at the Rs 900 strike price traded on CG Power & Industrial Solutions Ltd, with the stock closing at Rs 876.45 after a 5.09% gain. This alignment between options volume and cash market rally highlights a focused directional interest as the August expiry approaches.
Read full news article
CG Power & Industrial Solutions Ltd Sees Robust Trading Activity Amid Mixed Technical Signals
CG Power & Industrial Solutions Ltd emerged as one of the most actively traded stocks by value on 31 Jul 2026, registering a significant 5.09% gain and outperforming its sector by 3.3%. Despite a recent downgrade in its Mojo Grade from Buy to Hold, the large-cap heavy electrical equipment company continues to attract strong institutional interest and substantial order flow, reflecting a complex but promising market sentiment.
Read full news article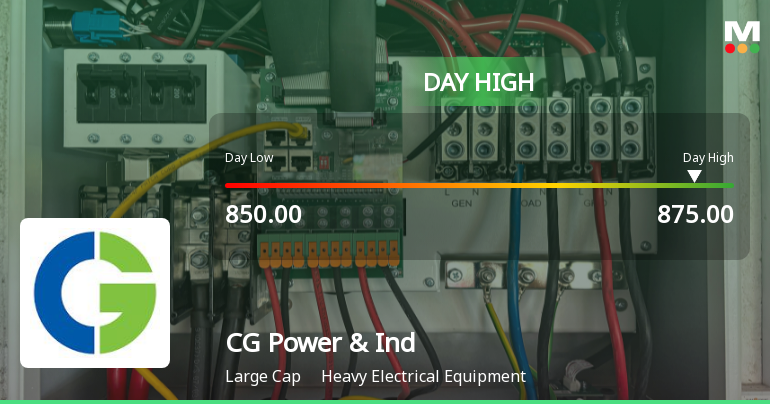
CG Power & Industrial Solutions Ltd Rallies 4.69% and Approaches 50 DMA Resistance — A Key Technical Test Ahead
The Sensex edged down by 0.02% on 31 Jul 2026, while CG Power & Industrial Solutions Ltd surged 4.69%, outperforming its sector by nearly 3.84 percentage points. This sharp single-session gain stands out as a stock-specific event amid a broadly flat market, raising questions about the sustainability of this momentum and the technical factors driving it.
Read full news article Announcements
CG Power and Industrial Solutions Limited - Scheme of Arrangement
09-Dec-2019 | Source : NSECG Power and Industrial Solutions Limited has informed the Exchange about withdrawal of Scheme of Amalgamation.
CG Power and Industrial Solutions Limited - Shareholders meeting
22-Nov-2019 | Source : NSECG Power and Industrial Solutions Limited has informed the Exchange regarding Notice of Annual General Meeting to be held on December 14, 2019
CG Power and Industrial Solutions Limited - Updates
21-Nov-2019 | Source : NSECG Power and Industrial Solutions Limited has informed the Exchange regarding 'Newspaper Advertisement for Intimation of the 82nd Annual General Meeting of the Company'.
Corporate Actions

No Upcoming Board Meetings

CG Power & Industrial Solutions Ltd has declared 65% dividend, ex-date: 30 Jan 26

CG Power & Industrial Solutions Ltd has announced 2:10 stock split, ex-date: 10 Aug 06

CG Power & Industrial Solutions Ltd has announced 3:4 bonus issue, ex-date: 08 Mar 10

No Rights history available
Quality key factors
Valuation key factors
Technicals key factors
 Technical Indicator Scale: Bearish, Mildly Bearish, Sideways, Mildly Bullish, Bullish Turned
 Shareholding Snapshot : Jun 2026
Shareholding Compare (%holding)
Promoters
None
Held by 42 Schemes (9.93%)
Held by 634 FIIs (11.97%)
Tube Investments Of India Limited (56.29%)
Nps Trust- A/c Sbi Pension Fund Scheme - State Govt (3.51%)
11.21%
Quarterly Results Snapshot (Consolidated) - Jun'26 - QoQ

QoQ Growth in quarter ended Jun 2026 is -4.68% vs 8.39% in Mar 2026
QoQ Growth in quarter ended Jun 2026 is -14.36% vs 28.32% in Mar 2026
Half Yearly Results Snapshot (Consolidated) - Sep'25

Growth in half year ended Sep 2025 is 25.01% vs 19.73% in Sep 2024
Growth in half year ended Sep 2025 is 20.31% vs 3.63% in Sep 2024
Nine Monthly Results Snapshot (Consolidated) - Dec'25
YoY Growth in nine months ended Dec 2025 is 25.44% vs 22.23% in Dec 2024
YoY Growth in nine months ended Dec 2025 is 19.66% vs -41.12% in Dec 2024
Annual Results Snapshot (Consolidated) - Mar'26
YoY Growth in year ended Mar 2026 is 25.32% vs 23.15% in Mar 2025
YoY Growth in year ended Mar 2026 is 23.77% vs -31.70% in Mar 2025
About CG Power & Industrial Solutions Ltd

Company Coordinates


