
Compare CG Power & Ind with Similar Stocks
Dashboard
Strong Long Term Fundamental Strength with an average Return on Equity (ROE) of 32.05%
- Healthy long term growth as Net Sales has grown by an annual rate of 33.18% and Operating profit at 133.13%
- The company is Net-Debt Free
Positive results in Mar 26
High Institutional Holdings at 30.11%
Company is among the highest 1% of companies rated by MarketsMojo across all 4,000 stocks
Market Beating performance in long term as well as near term
Stock DNA
Heavy Electrical Equipment
INR 146,906 Cr (Large Cap)
118.00
47
0.14%
-0.16
15.45%
18.77
Total Returns (Price + Dividend) 
Latest dividend: 1.3 per share ex-dividend date: Jan-30-2026
Risk Adjusted Returns v/s
Returns Beta

News
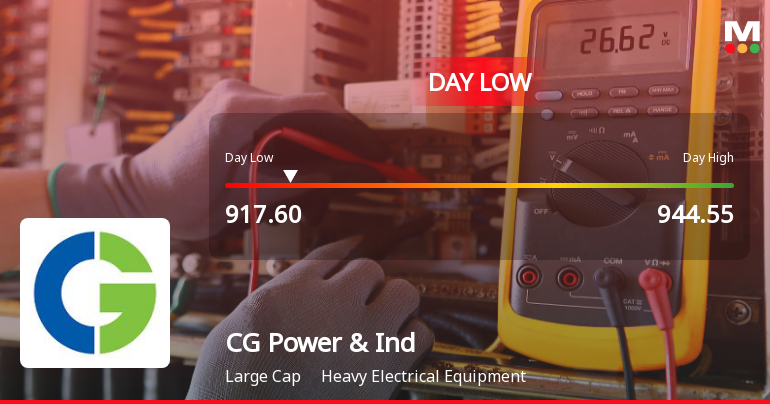
CG Power & Industrial Solutions Ltd Hits Intraday Low Amid Price Pressure
CG Power & Industrial Solutions Ltd experienced a notable intraday decline on 24 Jun 2026, touching a low of Rs 917.6, reflecting a 3.4% drop from previous levels. This downturn occurred despite a broadly positive market environment, with the Sensex advancing 1.13% during the session.
Read full news article
CG Power & Industrial Solutions Sees Significant Open Interest Surge Amid Mixed Price Action
CG Power & Industrial Solutions Ltd has witnessed a notable 11.13% increase in open interest in its derivatives segment, signalling heightened market activity despite the stock’s recent price underperformance. This surge in open interest, coupled with evolving volume patterns and shifting market positioning, offers valuable insights into investor sentiment and potential directional bets in the heavy electrical equipment sector.
Read full news article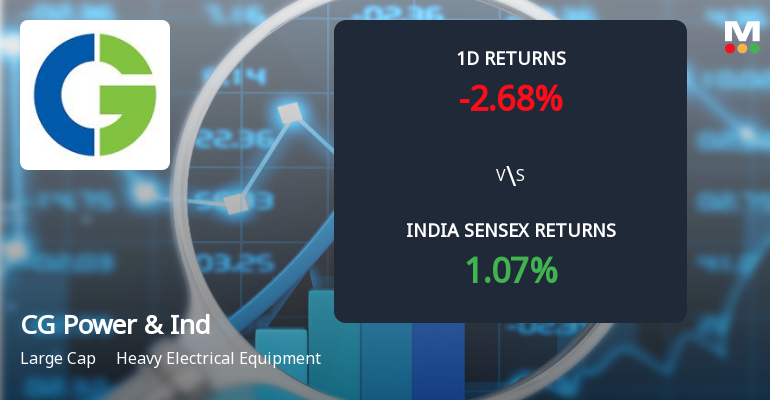
CG Power & Industrial Solutions Sees Sharp Open Interest Surge Amid Mixed Price Action
CG Power & Industrial Solutions Ltd has witnessed a notable 10.04% increase in open interest in its derivatives segment, signalling heightened market activity despite the stock’s recent underperformance. This surge in open interest, coupled with volume patterns and price movements, offers valuable insights into evolving market positioning and potential directional bets by investors.
Read full news article Announcements
Announcement under Regulation 30 (LODR)-Analyst / Investor Meet - Intimation
23-Jun-2026 | Source : BSEPlease find enclosed the disclosure for revision in schedule of investor/analysts meet.
Announcement under Regulation 30 (LODR)-Allotment of ESOP / ESPS
15-Jun-2026 | Source : BSEPlease find enclosed the disclosure regarding allotment of 21000 equity shares on 15th June 2026 pursuant to the Companys ESOP Plan 2021.
Announcement under Regulation 30 (LODR)-Analyst / Investor Meet - Intimation
10-Jun-2026 | Source : BSEPlease find enclosed the disclosure regarding schedule of investor or analysts meet scheduled on 18th June 2026.
Corporate Actions

No Upcoming Board Meetings

CG Power & Industrial Solutions Ltd has declared 65% dividend, ex-date: 30 Jan 26

CG Power & Industrial Solutions Ltd has announced 2:10 stock split, ex-date: 10 Aug 06

CG Power & Industrial Solutions Ltd has announced 3:4 bonus issue, ex-date: 08 Mar 10

No Rights history available
Quality key factors
Valuation key factors
Technicals key factors
 Technical Indicator Scale: Bearish, Mildly Bearish, Sideways, Mildly Bullish, Bullish Turned
 Shareholding Snapshot : Mar 2026
Shareholding Compare (%holding)
Promoters
None
Held by 38 Schemes (9.45%)
Held by 613 FIIs (12.03%)
Tube Investments Of India Limited (56.29%)
Qualified Institutional Buyers (4.05%)
11.36%
Quarterly Results Snapshot (Consolidated) - Mar'26 - QoQ

QoQ Growth in quarter ended Mar 2026 is 8.39% vs 8.64% in Dec 2025

QoQ Growth in quarter ended Mar 2026 is 28.32% vs -0.66% in Dec 2025
Half Yearly Results Snapshot (Consolidated) - Sep'25
Growth in half year ended Sep 2025 is 25.01% vs 19.73% in Sep 2024
Growth in half year ended Sep 2025 is 20.31% vs 3.63% in Sep 2024
Nine Monthly Results Snapshot (Consolidated) - Dec'25
YoY Growth in nine months ended Dec 2025 is 25.44% vs 22.23% in Dec 2024
YoY Growth in nine months ended Dec 2025 is 19.66% vs -41.12% in Dec 2024
Annual Results Snapshot (Consolidated) - Mar'26
YoY Growth in year ended Mar 2026 is 25.32% vs 23.15% in Mar 2025
YoY Growth in year ended Mar 2026 is 23.77% vs -31.70% in Mar 2025
About CG Power & Industrial Solutions Ltd

Company Coordinates


