
Compare Chamanlal Setia with Similar Stocks
Dashboard
Company has a Debt to Equity ratio (avg) of 0.04 times
Poor long term growth as Net Sales has grown by an annual rate of 11.07% and Operating profit at 6.16% over the last 5 years
Positive results in Mar 26
With ROE of 15.1, it has a Fair valuation with a 1.9 Price to Book Value
Despite the size of the company, domestic mutual funds hold only 0% of the company
Underperformed the market in the last 1 year
Stock DNA
Other Agricultural Products
INR 1,433 Cr (Micro Cap)
13.00
13
0.94%
-0.34
15.10%
1.74
Total Returns (Price + Dividend) 
Latest dividend: 2.5 per share ex-dividend date: Sep-15-2025
Risk Adjusted Returns v/s
Returns Beta

News

Chamanlal Setia Exports Ltd Upgraded to Hold on Technical Improvement and Financial Stability
Chamanlal Setia Exports Ltd, a micro-cap player in the Other Agricultural Products sector, has seen its investment rating upgraded from Sell to Hold as of 8 June 2026. This change reflects a nuanced improvement across technical indicators, financial performance, valuation metrics, and overall quality, signalling a cautious but positive outlook for investors.
Read full news article
Chamanlal Setia Exports Ltd Downgraded to Sell Amid Mixed Financials and Bearish Technicals
Chamanlal Setia Exports Ltd, a micro-cap player in the Other Agricultural Products sector, has seen its investment rating downgraded from Hold to Sell as of 1 June 2026. This change reflects a complex interplay of factors including deteriorating technical indicators, modest financial trends, valuation concerns, and overall quality assessments, signalling caution for investors despite some recent positive quarterly results.
Read full news article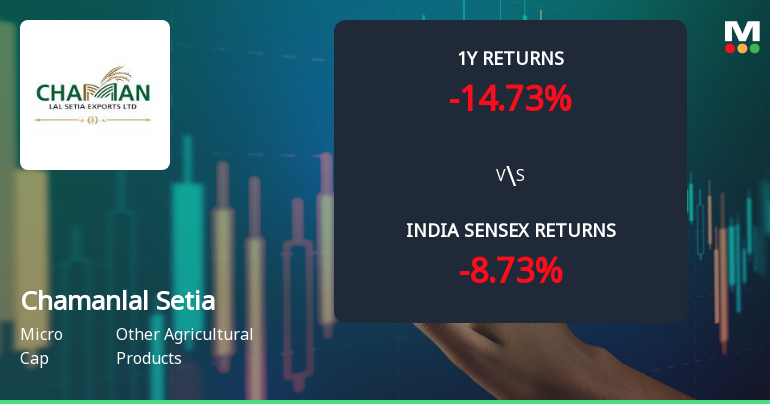
Chamanlal Setia Exports Ltd Faces Technical Momentum Shift Amid Mixed Market Signals
Chamanlal Setia Exports Ltd, a micro-cap player in the Other Agricultural Products sector, has experienced a subtle but notable shift in its technical momentum, moving from a mildly bullish to a mildly bearish stance. Despite a modest 1.42% gain in the latest session, the stock’s technical indicators present a complex picture, with mixed signals across weekly and monthly timeframes that warrant close attention from investors and market analysts alike.
Read full news article Announcements
Announcement under Regulation 30 (LODR)-Earnings Call Transcript
05-Jun-2026 | Source : BSETranscript of Concall held on 02.06.2026
Announcement under Regulation 30 (LODR)-Analyst / Investor Meet - Outcome
02-Jun-2026 | Source : BSEAudio Link of concall held on 02.06.2026.
Compliances-Reg.24(A)-Annual Secretarial Compliance
30-May-2026 | Source : BSEAnnual Secretarial Compliance Report for the year ended 31.03.2026
Corporate Actions

No Upcoming Board Meetings

Chamanlal Setia Exports Ltd has declared 125% dividend, ex-date: 15 Sep 25

Chamanlal Setia Exports Ltd has announced 2:10 stock split, ex-date: 28 Dec 15

Chamanlal Setia Exports Ltd has announced 1:10 bonus issue, ex-date: 14 Oct 16

No Rights history available
Quality key factors
Valuation key factors
Technicals key factors
 Technical Indicator Scale: Bearish, Mildly Bearish, Sideways, Mildly Bullish, Bullish Turned
 Shareholding Snapshot : Mar 2026
Shareholding Compare (%holding)
Promoters
None
Held by 0 Schemes
Held by 11 FIIs (3.09%)
Rajeev Setia (36.62%)
Altitude Investment Fund Pcc (2.96%)
16.89%
Quarterly Results Snapshot (Standalone) - Mar'26 - QoQ

QoQ Growth in quarter ended Mar 2026 is -0.61% vs 57.90% in Dec 2025
QoQ Growth in quarter ended Mar 2026 is 6.48% vs 89.86% in Dec 2025
Half Yearly Results Snapshot (Standalone) - Sep'25
Growth in half year ended Sep 2025 is -20.76% vs 28.01% in Sep 2024
Growth in half year ended Sep 2025 is -17.74% vs -8.16% in Sep 2024
Nine Monthly Results Snapshot (Standalone) - Dec'25
YoY Growth in nine months ended Dec 2025 is -10.32% vs 15.99% in Dec 2024

YoY Growth in nine months ended Dec 2025 is -2.32% vs -15.22% in Dec 2024
Annual Results Snapshot (Standalone) - Mar'26
YoY Growth in year ended Mar 2026 is -3.72% vs 10.30% in Mar 2025
YoY Growth in year ended Mar 2026 is 11.57% vs -11.03% in Mar 2025
About Chamanlal Setia Exports Ltd

Company Coordinates


