
Compare Gulshan Polyols with Similar Stocks
Dashboard
Low ability to service debt as the company has a high Debt to EBITDA ratio of 1.36 times
- Poor long term growth as Operating profit has grown by an annual rate 13.52% of over the last 5 years
- Low ability to service debt as the company has a high Debt to EBITDA ratio of 1.36 times
- The company has been able to generate a Return on Equity (avg) of 5.17% signifying low profitability per unit of shareholders funds
Poor long term growth as Operating profit has grown by an annual rate 13.52% of over the last 5 years
The company has declared Positive results for the last 4 consecutive quarters
With ROCE of 8.5, it has a Attractive valuation with a 1.4 Enterprise value to Capital Employed
Stock DNA
Other Agricultural Products
INR 1,128 Cr (Micro Cap)
26.00
46
0.17%
0.68
6.66%
1.76
Total Returns (Price + Dividend) 
Latest dividend: 0.3 per share ex-dividend date: Sep-11-2025
Risk Adjusted Returns v/s
Returns Beta

News
Gulshan Polyols Ltd Downgraded to Hold Amid Mixed Financial and Technical Signals
Gulshan Polyols Ltd, a micro-cap player in the Other Agricultural Products sector, has seen its investment rating downgraded from Buy to Hold as of 13 July 2026. This adjustment reflects a nuanced reassessment of the company’s quality, valuation, financial trends, and technical indicators, signalling a more cautious stance despite recent positive earnings momentum.
Read full news article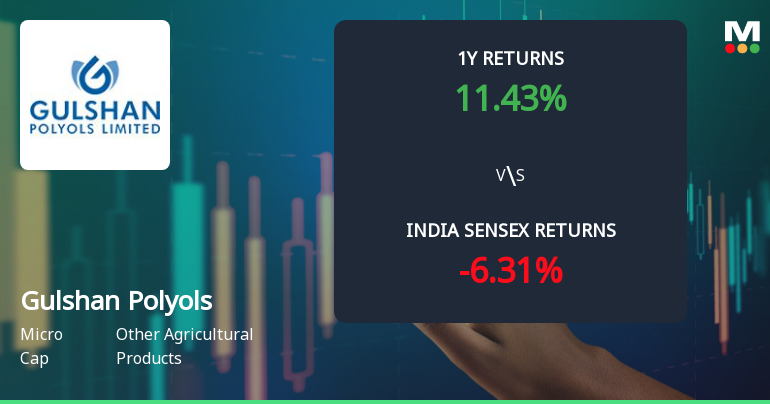
Gulshan Polyols Ltd Technical Momentum Shifts Amid Mixed Market Signals
Gulshan Polyols Ltd, a micro-cap player in the Other Agricultural Products sector, has experienced a nuanced shift in its technical momentum, reflecting a transition from bullish to mildly bullish trends. Despite a recent dip in price, the stock’s technical indicators present a complex picture, with mixed signals from MACD, RSI, moving averages, and volume-based metrics. This analysis delves into the evolving technical landscape and what it means for investors navigating this micro-cap stock.
Read full news article
Gulshan Polyols Ltd Upgraded to Buy on Strong Technical and Financial Performance
Gulshan Polyols Ltd, a micro-cap player in the Other Agricultural Products sector, has seen its investment rating upgraded from Hold to Buy by MarketsMOJO as of 6 July 2026. This upgrade reflects significant improvements across technical indicators, valuation metrics, financial trends, and overall quality assessments, signalling renewed investor confidence in the company’s prospects.
Read full news article Announcements
Intimation Regarding Media Interaction With ET Now Swadesh.
13-Jul-2026 | Source : BSEIntimation regarding Media Interaction with ET Now Swadesh.
Compliances-Certificate under Reg. 74 (5) of SEBI (DP) Regulations 2018
13-Jul-2026 | Source : BSECompliance Certificate under Regulation 74(5) of the SEBI (DP) Regulations 2018 for the quarter ended June 30 2026.
Intimation Regarding Media Interaction With ET Now.
07-Jul-2026 | Source : BSEIntimation regarding Media Interaction with ET Now.
Corporate Actions

No Upcoming Board Meetings

Gulshan Polyols Ltd has declared 30% dividend, ex-date: 11 Sep 25

Gulshan Polyols Ltd has announced 1:5 stock split, ex-date: 27 Dec 16

Gulshan Polyols Ltd has announced 1:5 bonus issue, ex-date: 21 Jun 23

No Rights history available
Quality key factors
Valuation key factors
Technicals key factors
 Technical Indicator Scale: Bearish, Mildly Bearish, Sideways, Mildly Bullish, Bullish Turned
 Shareholding Snapshot : Mar 2026
Shareholding Compare (%holding)
Promoters
None
Held by 0 Schemes
Held by 3 FIIs (0.3%)
Gulshan Family Benefit Trust(chandra Kumar Jain) (20.94%)
None
25.31%
Quarterly Results Snapshot (Standalone) - Mar'26 - QoQ

QoQ Growth in quarter ended Mar 2026 is -12.10% vs 15.68% in Dec 2025
QoQ Growth in quarter ended Mar 2026 is -8.22% vs 163.36% in Dec 2025
Half Yearly Results Snapshot (Consolidated) - Sep'25
Growth in half year ended Sep 2025 is 26.81% vs 48.85% in Sep 2024

Growth in half year ended Sep 2025 is 164.80% vs 66.56% in Sep 2024
Nine Monthly Results Snapshot (Standalone) - Dec'25
YoY Growth in nine months ended Dec 2025 is 17.07% vs 54.75% in Dec 2024
YoY Growth in nine months ended Dec 2025 is 291.67% vs 57.54% in Dec 2024
Annual Results Snapshot (Standalone) - Mar'26
YoY Growth in year ended Mar 2026 is 14.49% vs 46.57% in Mar 2025
YoY Growth in year ended Mar 2026 is 332.23% vs 40.53% in Mar 2025
About Gulshan Polyols Ltd

Company Coordinates


