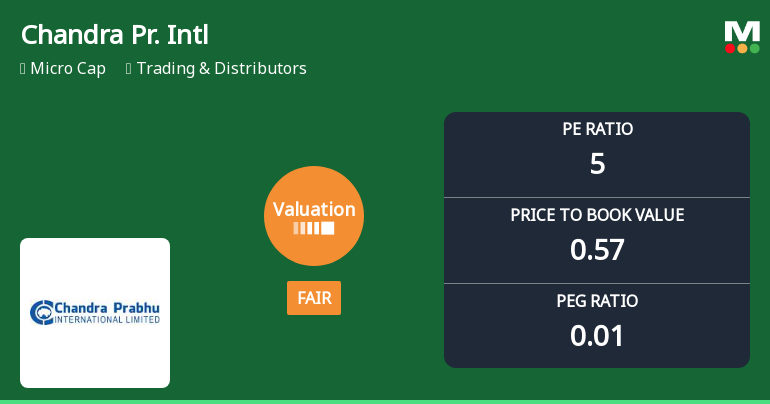
Chandra Pr. Intl

  • Market Cap: Micro Cap
  • Industry: Trading & Distributors
  • ISIN: INE368D01025
  • NSEID:
  • BSEID: 530309
INR
10.37
-0.25 (-2.35%)
BSENSE

Sep 01, 03:30 PM

BSE+NSE Vol: 7.93 k

  • Price Points
  • Score
  • Mojo Parameters
  • Total Return
  • News and Corporate Actions
  • Key factors
  • Shareholding
  • Financials
  • CompanyCV
stock-summaryPrice Point
High/Low

1Day

52 Week

Valuation
Technical
Day's Volume

CASH

7.93 k (-13.48%) Volume

Shareholding (Jun 2026)

FII

0.00%

Held by 0 FIIs

DII

0.00%

Held by 0 DIIs

Promoter

54.34%

Why is Chandra Prabhu International Ltd falling/rising?

02-Sep-2026

As of 01-Sep, Chandra Prabhu International Ltd's stock price is declining, with a current drop of 2.35% and significant underperformance over various periods. Despite recent profit growth, long-term fundamentals are weak, highlighted by a high debt to EBITDA ratio and a negative compound annual growth rate in operating profits.

As of 01-Sep, Chandra Prabhu International Ltd's stock price is currently falling, as indicated by a change of -0.25, which represents a decline of 2.35%. This downward movement is reflected in the stock's performance over various periods, including a 1-week decline of 4.95% and a 1-month decline of 15.83%. Additionally, the stock has significantly underperformed against the benchmark, with a 3-year return of -36.96% compared to the Sensex's gain of 17.67%.<BR><BR>Despite some positive factors, such as impressive growth in profit before tax, profit after tax, and net sales in the most recent quarter, the overall long-term fundamentals appear weak. The company has shown a -13.11% compound annual growth rate in operating profits over the last five years and has a high debt to EBITDA ratio of -63.08 times, indicating a low ability to service its debt. Furthermore, the stock is trading below its moving averages and has consistently underperformed against the benchmark over the last three years, contributing to the current decline in its stock price.

View full answer

Who are in the management team of Chandra Pr. Intl?

01-Sep-2026

The management team of Chandra Pr. Intl includes Gajraj Jain (Chairman/Executive Director), Hemlata Jain (Non-Executive Director), Jitendra Kumar Mishra, Tilak Raj Goyal, and Punit Jain (all Independent Non-Executive Directors), and Pradeep Kumar Goyal (Non-Executive & Non-Independent Director).

The management team of Chandra Pr. Intl includes the following members:<BR><BR>1. **Gajraj Jain** - Chairman / Executive Director<BR>2. **Hemlata Jain** - Non-Executive Director<BR>3. **Jitendra Kumar Mishra** - Independent Non-Executive Director<BR>4. **Tilak Raj Goyal** - Independent Non-Executive Director<BR>5. **Punit Jain** - Independent Non-Executive Director<BR>6. **Pradeep Kumar Goyal** - Non-Executive & Non-Independent Director<BR><BR>If you need more details about their roles or contributions, feel free to ask!

View full answer

What does Chandra Pr. Intl do?

01-Sep-2026

Chandra Prabhu International Ltd, incorporated in 1984, trades in coal, synthetic rubber, and chemicals, with a market cap of INR 29 Cr. As of June 2026, it reported net sales of 231 Cr and a net profit of 2 Cr, with a P/E ratio of 4.00.

Overview: <BR>Chandra Prabhu International Ltd is engaged in the trading of Coal, Synthetic Rubber, and Chemicals, operating within the Trading & Distributors industry and classified as a Micro Cap company.<BR><BR>History: <BR>Chandra Prabhu International Ltd was incorporated in 1984. The latest quarterly results reported net sales and net profit for June 2026.<BR><BR>Financial Snapshot: <BR>Most recent Net Sales: 231 Cr (Quarterly Results - Jun 2026) <BR>Most recent Net Profit: 2 Cr (Quarterly Results - Jun 2026) <BR>Market-cap value: INR 29 Cr (Micro Cap)<BR><BR>Key Metrics: <BR>P/E: 4.00 <BR>Industry P/E: 21 <BR>Dividend Yield: 0.00% <BR>Debt-Equity: 0.60 <BR>Return on Equity: 12.54% <BR>Price to Book: 0.56 <BR><BR>Contact Details: <BR>Address: 14 Rani Jhansi Road, New Delhi, New Delhi: 110055 <BR>Tel: 91-11-23516567/32559597 <BR>Email: info@cpil.com <BR>Website: http://www.cpil.com

View full answer

Who are the peers of the Chandra Pr. Intl?

01-Sep-2026

Chandra Pr. Intl's peers include Kaiser Corporat., Khyati Global, Contil India, and others, with varying management risks and growth rates. Notably, Kaiser Corporat. has the highest 1-year return at 23.02%, while Chandra Pr. Intl's return is -17.03%.

Peers: The peers of Chandra Pr. Intl are Kaiser Corporat., Khyati Global, Contil India, AA Plus Trade, Sunil Industries, Le Lavoir, Newtrac Foods, Medico Intercon., and Nirav Commercial.<BR><BR>Quality Snapshot: Excellent management risk is observed at Contil India and Le Lavoir, while Average management risk is found at Khyati Global and Newtrac Foods, and the rest have Below Average management risk. Good growth is noted at Khyati Global and Contil India, while Below Average growth is seen at Chandra Pr. Intl, Kaiser Corporat., AA Plus Trade, Sunil Industries, Le Lavoir, Newtrac Foods, Medico Intercon., Nirav Commercial, and the rest. Excellent capital structure is present at Contil India and Medico Intercon., while Below Average capital structure is found at Kaiser Corporat., Khyati Global, AA Plus Trade, Sunil Industries, Newtrac Foods, Chandra Pr. Intl, Nirav Commercial, and the rest.<BR><BR>Return Snapshot: The peer with the highest 1-year return is Kaiser Corporat. at 23.02%, while Khyati Global has the lowest at -37.00%. Chandra Pr. Intl's 1-year return is -17.03%, which is better than Khyati Global but worse than Kaiser Corporat. Additionally, peers with negative six-month returns include Khyati Global, Contil India, Sunil Industries, Le Lavoir, Newtrac Foods, and Medico Intercon.

View full answer

How big is Chandra Pr. Intl?

01-Sep-2026

Summary could not be generated.

As of 31st August, Chandra Prabhu International Ltd has a market capitalization of 29.00 Cr, categorized as a Micro Cap.<BR><BR>In the latest four quarters, the company reported Net Sales of 108.30 Cr and a Net Profit of 2.27 Cr.<BR><BR>The reporting period for the balance sheet is the latest annual period, but data for Shareholder's Funds and Total Assets is unavailable.

View full answer

Should I buy, sell or hold Chandra Prabhu International Ltd?

31-Aug-2026

When is the next results date for Chandra Prabhu International Ltd?

24-Jul-2026

The next results date for Chandra Prabhu International Ltd is July 29, 2026.

The next results date for Chandra Prabhu International Ltd is scheduled for July 29, 2026.

View full answer

Are Chandra Prabhu International Ltd latest results good or bad?

31-Jan-2026

Chandra Prabhu International Ltd's latest results are concerning, with a 61.30% decline in net sales and a net loss of ₹1.40 crores for the first half of FY26. The company's ROCE has dropped to 3.66%, indicating significant operational challenges, and it is rated as a "STRONG SELL."

Chandra Prabhu International Ltd's latest results indicate a troubling situation for the company. In the most recent quarter (Q3 FY26), net sales fell to ₹88.85 crores, representing a significant decline of 61.30% compared to the average of the previous four quarters. Additionally, the company reported a net loss of ₹1.40 crores for the first half of FY26, which marks a deterioration of 58.69% compared to the prior period.<BR><BR>The company's Return on Capital Employed (ROCE) has also dropped to a multi-quarter low of 3.66%, well below its historical average of 26.37%. This suggests serious challenges in capital efficiency and operational performance. Furthermore, the company's Mojo Score has plummeted to just 9 out of 100, placing it firmly in "STRONG SELL" territory.<BR><BR>Overall, the financial performance reflects a company in distress, with collapsing revenues, mounting losses, and a lack of institutional interest. The current outlook is quite negative, and it is advisable for investors to approach this stock with caution.

View full answer

Is Chandra Pr. Intl overvalued or undervalued?

10-Nov-2025

As of November 7, 2025, Chandra Pr. Intl is considered overvalued and risky, with concerning financial ratios such as a PE of -11.89 and a 33.09% decline in stock performance over the past year, contrasting sharply with its peers.

As of 7 November 2025, Chandra Pr. Intl has moved from an attractive to a risky valuation grade. The company appears to be overvalued based on its current financial ratios, including a PE ratio of -11.89, an EV to EBITDA of -98.19, and a ROE of -5.62%. These figures indicate significant financial distress, particularly with negative earnings and a low return on equity.<BR><BR>In comparison to its peers, Chandra Pr. Intl's valuation metrics are concerning. For instance, Elitecon International has a PE ratio of 378.62, while PTC India, which is very attractive, has a PE of 7.9. The stark contrast in these ratios suggests that Chandra Pr. Intl is not only underperforming compared to its peers but is also facing challenges that could further impact its valuation. Recent stock performance shows a decline of 33.09% over the past year, while the Sensex has increased by 4.62%, reinforcing the notion that the company is overvalued in the current market context.

View full answer

How has been the historical performance of Chandra Pr. Intl?

09-Nov-2025

Chandra Pr. Intl has shown significant improvement in financial performance, with net sales rising from 37.21 Cr in March 2017 to 91.13 Cr in March 2019, and a turnaround from an operating loss of 5.10 Cr in March 2018 to a profit of 5.40 Cr in March 2019. Key metrics, including profit after tax and earnings per share, also reflect a strong recovery and growth trajectory.

Answer:<BR>The historical performance of Chandra Pr. Intl shows a significant improvement in net sales and profitability over the years, particularly in the fiscal year ending March 2019.<BR><BR>Breakdown:<BR>Chandra Pr. Intl's net sales increased from 37.21 Cr in March 2017 to 91.13 Cr in March 2019, demonstrating a strong upward trend. The total operating income followed a similar pattern, rising from 49.60 Cr in March 2016 to 91.13 Cr in March 2019. The company experienced a notable turnaround in operating profit, moving from a loss of 5.10 Cr in March 2018 to a profit of 5.40 Cr in March 2019. This improvement is reflected in the operating profit margin, which shifted from -7.7% in March 2018 to 5.82% in March 2019. Profit before tax also saw a positive change, increasing from -5.61 Cr in March 2018 to 4.20 Cr in March 2019, leading to a profit after tax of 3.36 Cr in March 2019, compared to a loss of 4.07 Cr the previous year. The earnings per share (EPS) improved significantly from -11.0 in March 2018 to 9.08 in March 2019, indicating a strong recovery in profitability. Overall, the financial metrics highlight a robust recovery and growth trajectory for Chandra Pr. Intl in the latest fiscal year.

View full answer

What is the bonus history of Chandra Pr. Intl?

19-Sep-2025

Chandra Prabhu International Ltd announced a 1:2 bonus issue, with an ex-date of September 26, 2025. Shareholders on record will receive one additional share for every two shares held.

Chandra Prabhu International Ltd has a recent bonus issue history where they announced a 1:2 bonus. The ex-date for this bonus issue is set for September 26, 2025. This means that shareholders on record as of that date will receive one additional share for every two shares they hold. If you have any more questions about the company or its financial activities, feel free to ask!

View full answer

What is the technical trend for Chandra Pr. Intl?

09-Jun-2025

As of May 22, 2025, Chandra Pr. Intl's technical trend is mildly bearish, with bearish moving averages and Bollinger Bands, although weekly indicators like MACD and KST show some mildly bullish signals.

As of 22 May 2025, the technical trend for Chandra Pr. Intl has changed from bearish to mildly bearish. The weekly MACD indicates a mildly bullish stance, while the monthly MACD remains bearish. The moving averages on a daily basis are mildly bearish, and Bollinger Bands are bearish on both weekly and monthly time frames. The KST shows a mildly bullish signal weekly but is bearish monthly. Dow Theory supports a mildly bullish outlook in both weekly and monthly contexts. Overall, the current technical stance is mildly bearish, driven primarily by the bearish moving averages and Bollinger Bands, despite some mildly bullish signals from MACD and KST on the weekly chart.

View full answer

Who are the top shareholders of the Chandra Pr. Intl?

06-Jun-2025

The top shareholder of Chandra Pr. Intl is Hemlata Jain, holding 32.83%, with no pledged promoter holdings. Individual investors own 42.59%, while the highest public shareholder is Pranaba Kumar Nayak at 1.53%.

The top shareholders of Chandra Pr. Intl are primarily the promoters, with Hemlata Jain holding the largest share at 32.83%. There are no pledged promoter holdings, and the company does not have any mutual funds or foreign institutional investors (FIIs) holding shares. The highest public shareholder is Pranaba Kumar Nayak, who holds 1.53%. Additionally, individual investors collectively own 42.59% of the company.

View full answer

Has Chandra Pr. Intl declared dividend?

06-Jun-2025

Chandra Prabhu International Ltd has declared a 10% dividend, amounting to 0.2 per share, with an ex-date of September 18, 2023. Despite the dividend declaration, recent total returns show significant volatility, with negative returns in shorter periods and substantial gains over longer terms.

Chandra Prabhu International Ltd has declared a 10% dividend.<BR><BR>Dividend Details:<BR>- Percentage announced: 10%<BR>- Amount per share: 0.2<BR>- Ex-date: 18 Sep 23<BR><BR>Dividend Yield: 0%<BR><BR>Total Returns by Period:<BR>In the 6-month period, the price return was -23.11%, with a dividend return of 0%, resulting in a total return of -23.11%.<BR><BR>For the 1-year period, the price return was -25.33%, the dividend return was 0%, leading to a total return of -25.33%.<BR><BR>Over the 2-year period, the price return was -22.12%, with a dividend return of 0.84%, culminating in a total return of -21.28%.<BR><BR>In the 3-year period, the price return was -52.0%, the dividend return was 5.12%, resulting in a total return of -46.88%.<BR><BR>For the 4-year period, the price return was 151.95%, with a dividend return of 31.40%, leading to a total return of 183.35%.<BR><BR>In the 5-year period, the price return was 538.16%, the dividend return was 74.18%, resulting in a total return of 612.34%.<BR><BR>Overall, while Chandra Prabhu International Ltd has declared a dividend, the total returns over recent periods indicate significant volatility, with negative returns in the shorter terms but substantial positive returns over longer periods.

View full answer
iScoreScore
Click here to find our call on this stock
Strong Sell
Sell
Hold
Buy
Strong Buy

Dashboard

1

Weak Long Term Fundamental Strength with a -13.11% CAGR growth in Operating Profits over the last 5 years

  • Low ability to service debt as the company has a high Debt to EBITDA ratio of -63.08 times
2

Consistent Underperformance against the benchmark over the last 3 years

stock-summaryMojo Parameters

Mojo Parameters

Loading Valuation Snapshot...

Stock DNA

stock-summary
Industry

Trading & Distributors

stock-summary
Market cap

INR 29 Cr (Micro Cap)

stock-summary
P/E

5.00

stock-summary
Industry P/E

21

stock-summary
Dividend Yield

0.00%

stock-summary
Debt Equity

0.60

stock-summary
Return on Equity

12.54%

stock-summary
Price to Book

0.56

Revenue and Profits:
Net Sales:
231 Cr
(Quarterly Results - Jun 2026)
Net Profit:
2 Cr
stock-summaryTotal Returns
Total Returns (Price + Dividend) stock-summary
Dividend Yield (0%)
TimePeriod
Price Return
Dividend Return
Total Return
3 Months
-27.53%
0%
-27.53%
6 Months
-13.73%
0%
-13.73%
1 Year
-17.3%
0%
-17.3%
2 Years
-43.61%
0%
-43.61%
3 Years
-36.96%
0%
-36.96%
4 Years
-66.24%
0.59%
-65.65%
5 Years
-53.31%
1.63%
-51.68%

Latest dividend: 0.13336120401337792 per share ex-dividend date: Sep-18-2023

Risk Adjusted Returns v/s stock-summary
Returns Beta
Icon
Beta has not been calculated since enough price history is not available
stock-summaryNews & Corporate Actions

News

Chandra Prabhu International Ltd Gains 2.98%: 3 Key Factors Driving the Move

Announcements stock-summary

Announcement under Regulation 30 (LODR)-Change in Management

31-Aug-2026 | Source : BSE

Appointment of Ms. Vandana Singh as an Additional Director (Non-executive Non-Independent)

Shareholder Meeting / Postal Ballot-Outcome of AGM

31-Aug-2026 | Source : BSE

Outcome of the AGM held on August 31 2026

Board Meeting Outcome for Outcome Of Board Meeting

31-Aug-2026 | Source : BSE

Outcome of Board Meeting

Corporate Actions stock-summary

stock-summary
BOARD MEETING

No Upcoming Board Meetings

stock-summary
DIVIDEND

Chandra Prabhu International Ltd has declared 10% dividend, ex-date: 18 Sep 23

stock-summary
SPLITS

Chandra Prabhu International Ltd has announced 2:10 stock split, ex-date: 30 Nov 22

stock-summary
BONUS

Chandra Prabhu International Ltd has announced 1:2 bonus issue, ex-date: 26 Sep 25

stock-summary
RIGHTS

No Rights history available

stock-summaryKey Factors

Quality key factors stock-summary

Factor
Value
Sales Growth (5y)
8.83%
EBIT Growth (5y)
-13.11%
EBIT to Interest (avg)
6.42
Debt to EBITDA (avg)
Negative Net Debt
Net Debt to Equity (avg)
0.60
Sales to Capital Employed (avg)
10.57
Tax Ratio
13.34%
Dividend Payout Ratio
0
Pledged Shares
0
Institutional Holding
0
ROCE (avg)
26.37%
ROE (avg)
15.07%

Valuation key factors

Factor
Value
P/E Ratio
5
Industry P/E
21
Price to Book Value
0.57
EV to EBIT
6.33
EV to EBITDA
6.00
EV to Capital Employed
0.73
EV to Sales
0.11
PEG Ratio
0.01
Dividend Yield
NA
ROCE (Latest)
-1.30%
ROE (Latest)
12.54%

Technicals key factors

Indicator
Weekly
Monthly
MACD
Bearish
Mildly Bullish
RSI
No Signal
Bullish
Bollinger Bands
Mildly Bearish
Mildly Bearish
Moving Averages
Bearish (Daily)
KST
Bearish
Mildly Bullish
Dow Theory
No Trend
No Trend
stock-summary Technical Indicator Scale: Bearish, Mildly Bearish, Sideways, Mildly Bullish, Bullish  Turned 
stock-summaryShareholding
Shareholding Snapshot : Jun 2026stock-summary
Shareholding Compare (%holding) stock-summary
Majority shareholders

Promoters

Pledged Promoter Holdings

None

Mutual Funds

Held by 0 Schemes

FIIs

Held by 0 FIIs

Promoter with highest holding

Hemlata Jain (32.83%)

Highest Public shareholder

Pranaba Kumar Nayak (1.63%)

Individual Investors Holdings

42.91%

stock-summaryFinancial
[
  {
    "link": "quarterly",
    "btn_text": "All Quarterly Results",
    "header": "Quarterly Results Snapshot (Standalone) - Jun'26 - QoQ",
    "rhs": [
      {
        "prefix": "Net Sales ",
        "suffix": "QoQ Growth in quarter ended Jun 2026 is 40.46% vs 84.88% in Mar 2026",
        "dir": -1
      },
      {
        "prefix": "Standalone Net Profit ",
        "suffix": "QoQ Growth in quarter ended Jun 2026 is -65.44% vs 3,643.75% in Mar 2026",
        "dir": -1
      }
    ],
    "table": {
      "header": [
        "Jun'26",
        "Mar'26",
        "Change(%)"
      ],
      "body": [
        {
          "field": "Net Sales",
          "val1": "230.74",
          "val2": "164.27",
          "chgp": "40.46%",
          "chgp_class": "positive"
        },
        {
          "field": "Operating Profit (PBDIT) excl Other Income",
          "val1": "2.86",
          "val2": "6.87",
          "chgp": "-58.37%",
          "chgp_class": "negative"
        },
        {
          "field": "Interest",
          "val1": "0.51",
          "val2": "1.05",
          "chgp": "-51.43%",
          "chgp_class": "positive"
        },
        {
          "field": "Exceptional Items",
          "val1": "0.00",
          "val2": "0.12",
          "chgp": "-100.00%",
          "chgp_class": "negative"
        },
        {
          "field": "Standalone Net Profit",
          "val1": "2.07",
          "val2": "5.99",
          "chgp": "-65.44%",
          "chgp_class": "negative"
        },
        {
          "field": "Operating Profit Margin (Excl OI)",
          "val1": "1.24%",
          "val2": "4.18%",
          "chgp": "-2.94%",
          "chgp_class": "negative"
        }
      ]
    }
  },
  {
    "link": "half-yearly",
    "btn_text": "All Half Yearly Results",
    "header": "Half Yearly Results Snapshot (Standalone) - Sep'25",
    "rhs": [
      {
        "prefix": "Net Sales ",
        "suffix": " Growth in half year ended Sep 2025 is -17.87% vs -2.88% in Sep 2024",
        "dir": -1
      },
      {
        "prefix": "Standalone Net Profit ",
        "suffix": " Growth in half year ended Sep 2025 is -301.23% vs -160.45% in Sep 2024",
        "dir": -1
      }
    ],
    "table": {
      "header": [
        "Sep'25",
        "Sep'24",
        "Change(%)"
      ],
      "body": [
        {
          "field": "Net Sales",
          "val1": "352.09",
          "val2": "428.69",
          "chgp": "-17.87%",
          "chgp_class": "negative"
        },
        {
          "field": "Operating Profit (PBDIT) excl Other Income",
          "val1": "-3.79",
          "val2": "2.42",
          "chgp": "-256.61%",
          "chgp_class": "negative"
        },
        {
          "field": "Interest",
          "val1": "2.23",
          "val2": "3.46",
          "chgp": "-35.55%",
          "chgp_class": "positive"
        },
        {
          "field": "Exceptional Items",
          "val1": "2.70",
          "val2": "0.00",
          "chgp": "",
          "chgp_class": "neutral"
        },
        {
          "field": "Standalone Net Profit",
          "val1": "-3.25",
          "val2": "-0.81",
          "chgp": "-301.23%",
          "chgp_class": "negative"
        },
        {
          "field": "Operating Profit Margin (Excl OI)",
          "val1": "-1.08%",
          "val2": "0.56%",
          "chgp": "-1.64%",
          "chgp_class": "negative"
        }
      ]
    }
  },
  {
    "link": "nine-monthly",
    "btn_text": "All Nine Monthly Results",
    "header": "Nine Monthly Results Snapshot (Standalone) - Dec'25",
    "rhs": [
      {
        "prefix": "Net Sales ",
        "suffix": "YoY Growth in nine months ended Dec 2025 is -36.45% vs 8.30% in Dec 2024",
        "dir": -1
      },
      {
        "prefix": "Standalone Net Profit ",
        "suffix": "YoY Growth in nine months ended Dec 2025 is -224.60% vs 8.77% in Dec 2024",
        "dir": -1
      }
    ],
    "table": {
      "header": [
        "Dec'25",
        "Dec'24",
        "Change(%)"
      ],
      "body": [
        {
          "field": "Net Sales",
          "val1": "440.94",
          "val2": "693.85",
          "chgp": "-36.45%",
          "chgp_class": "negative"
        },
        {
          "field": "Operating Profit (PBDIT) excl Other Income",
          "val1": "-2.90",
          "val2": "5.57",
          "chgp": "-152.06%",
          "chgp_class": "negative"
        },
        {
          "field": "Interest",
          "val1": "3.18",
          "val2": "5.79",
          "chgp": "-45.08%",
          "chgp_class": "positive"
        },
        {
          "field": "Exceptional Items",
          "val1": "2.86",
          "val2": "0.00",
          "chgp": "",
          "chgp_class": "neutral"
        },
        {
          "field": "Standalone Net Profit",
          "val1": "-3.09",
          "val2": "2.48",
          "chgp": "-224.60%",
          "chgp_class": "negative"
        },
        {
          "field": "Operating Profit Margin (Excl OI)",
          "val1": "-0.66%",
          "val2": "0.80%",
          "chgp": "-1.46%",
          "chgp_class": "negative"
        }
      ]
    }
  },
  {
    "link": "annual",
    "btn_text": "All Annual Results",
    "header": "Annual Results Snapshot (Standalone) - Mar'26",
    "rhs": [
      {
        "prefix": "Net Sales ",
        "suffix": "YoY Growth in year ended Mar 2026 is -39.13% vs 16.31% in Mar 2025",
        "dir": -1
      },
      {
        "prefix": "Standalone Net Profit ",
        "suffix": "YoY Growth in year ended Mar 2026 is 22.88% vs 202.56% in Mar 2025",
        "dir": -1
      }
    ],
    "table": {
      "header": [
        "Mar'26",
        "Mar'25",
        "Change(%)"
      ],
      "body": [
        {
          "field": "Net Sales",
          "val1": "605.21",
          "val2": "994.26",
          "chgp": "-39.13%",
          "chgp_class": "negative"
        },
        {
          "field": "Operating Profit (PBDIT) excl Other Income",
          "val1": "3.97",
          "val2": "6.09",
          "chgp": "-34.81%",
          "chgp_class": "negative"
        },
        {
          "field": "Interest",
          "val1": "4.23",
          "val2": "7.11",
          "chgp": "-40.51%",
          "chgp_class": "positive"
        },
        {
          "field": "Exceptional Items",
          "val1": "2.98",
          "val2": "0.00",
          "chgp": "",
          "chgp_class": "neutral"
        },
        {
          "field": "Standalone Net Profit",
          "val1": "2.90",
          "val2": "2.36",
          "chgp": "22.88%",
          "chgp_class": "positive"
        },
        {
          "field": "Operating Profit Margin (Excl OI)",
          "val1": "0.66%",
          "val2": "0.61%",
          "chgp": "0.05%",
          "chgp_class": "positive"
        }
      ]
    }
  }
]

Quarterly Results Snapshot (Standalone) - Jun'26 - QoQstock-summary

Jun'26
Mar'26
Change(%)
Net Sales
230.74
164.27
40.46%
Operating Profit (PBDIT) excl Other Income
2.86
6.87
-58.37%
Interest
0.51
1.05
-51.43%
Exceptional Items
0.00
0.12
-100.00%
Standalone Net Profit
2.07
5.99
-65.44%
Operating Profit Margin (Excl OI)
1.24%
4.18%
-2.94%
Values in Rs Cr.
Direction Arrows
Net Sales

QoQ Growth in quarter ended Jun 2026 is 40.46% vs 84.88% in Mar 2026

Direction Arrows
Standalone Net Profit

QoQ Growth in quarter ended Jun 2026 is -65.44% vs 3,643.75% in Mar 2026

Half Yearly Results Snapshot (Standalone) - Sep'25stock-summary

Sep'25
Sep'24
Change(%)
Net Sales
352.09
428.69
-17.87%
Operating Profit (PBDIT) excl Other Income
-3.79
2.42
-256.61%
Interest
2.23
3.46
-35.55%
Exceptional Items
2.70
0.00
Standalone Net Profit
-3.25
-0.81
-301.23%
Operating Profit Margin (Excl OI)
-1.08%
0.56%
-1.64%
Values in Rs Cr.
Direction Arrows
Net Sales

Growth in half year ended Sep 2025 is -17.87% vs -2.88% in Sep 2024

Direction Arrows
Standalone Net Profit

Growth in half year ended Sep 2025 is -301.23% vs -160.45% in Sep 2024

Nine Monthly Results Snapshot (Standalone) - Dec'25stock-summary

Dec'25
Dec'24
Change(%)
Net Sales
440.94
693.85
-36.45%
Operating Profit (PBDIT) excl Other Income
-2.90
5.57
-152.06%
Interest
3.18
5.79
-45.08%
Exceptional Items
2.86
0.00
Standalone Net Profit
-3.09
2.48
-224.60%
Operating Profit Margin (Excl OI)
-0.66%
0.80%
-1.46%
Values in Rs Cr.
Direction Arrows
Net Sales

YoY Growth in nine months ended Dec 2025 is -36.45% vs 8.30% in Dec 2024

Direction Arrows
Standalone Net Profit

YoY Growth in nine months ended Dec 2025 is -224.60% vs 8.77% in Dec 2024

Annual Results Snapshot (Standalone) - Mar'26stock-summary

Mar'26
Mar'25
Change(%)
Net Sales
605.21
994.26
-39.13%
Operating Profit (PBDIT) excl Other Income
3.97
6.09
-34.81%
Interest
4.23
7.11
-40.51%
Exceptional Items
2.98
0.00
Standalone Net Profit
2.90
2.36
22.88%
Operating Profit Margin (Excl OI)
0.66%
0.61%
0.05%
Values in Rs Cr.
Direction Arrows
Net Sales

YoY Growth in year ended Mar 2026 is -39.13% vs 16.31% in Mar 2025

Direction Arrows
Standalone Net Profit

YoY Growth in year ended Mar 2026 is 22.88% vs 202.56% in Mar 2025

stock-summaryCompany CV
About Chandra Prabhu International Ltd stock-summary
stock-summary
Chandra Prabhu International Ltd
Micro Cap
Trading & Distributors
Chandra Prabhu International Limited was incorporated in year 1984. The Company has its presence all over India through its branch offices namely Mughal Sarai, Guwahati, Bhatinda, & Siliguri. In addition to the above, Company enjoys a huge warehouse capacity of approx 40,000 sq.ft., comprising of godowns and warehouses across the country. The Company is engaged mainly, in the business of trading of Coal, Synthetic Rubber and Chemicals for last many years.
Company Coordinates stock-summary
Company Details
14 Rani Jhansi Road , New Delhi New Delhi : 110055
stock-summary
Tel: 91-11-23516567/32559597
stock-summary
info@cpil.com
Registrar Details
Alankit Assignments Ltd , Alankit House , 2 E/21, Jhandewala Extension, New Delhi