
Compare Chart.Logistics with Similar Stocks
Dashboard
Weak Long Term Fundamental Strength with an average Return on Capital Employed (ROCE) of 0%
- Poor long term growth as Net Sales has grown by an annual rate of -11.46% and Operating profit at -176.80% over the last 5 years
- Company's ability to service its debt is weak with a poor EBIT to Interest (avg) ratio of 0.24
Flat results in Mar 26
Risky - Negative Operating Profits
Underperformed the market in the last 1 year
Stock DNA
Transport Services
INR 79 Cr (Micro Cap)
NA (Loss Making)
37
0.00%
0.22
-3.53%
1.17
Total Returns (Price + Dividend) 
Latest dividend: 0.10000000000000002 per share ex-dividend date: Oct-25-2011
Risk Adjusted Returns v/s
Returns Beta

News

Chartered Logistics Ltd is Rated Strong Sell
Chartered Logistics Ltd is rated Strong Sell by MarketsMOJO, with this rating last updated on 23 September 2025. However, the analysis and financial metrics discussed here reflect the company’s current position as of 28 June 2026, providing investors with an up-to-date view of its performance and outlook.
Read full news article
Chartered Logistics Ltd is Rated Strong Sell
Chartered Logistics Ltd is rated Strong Sell by MarketsMOJO, with this rating last updated on 23 September 2025. However, the analysis and financial metrics discussed here reflect the company’s current position as of 17 June 2026, providing investors with an up-to-date perspective on the stock’s fundamentals, valuation, financial trend, and technical outlook.
Read full news article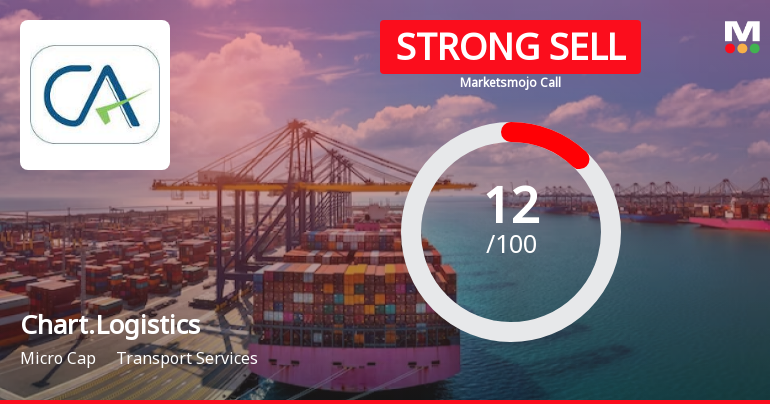
Chartered Logistics Ltd is Rated Strong Sell
Chartered Logistics Ltd is rated Strong Sell by MarketsMOJO, with this rating last updated on 23 September 2025. However, the analysis and financial metrics discussed here reflect the company’s current position as of 04 June 2026, providing investors with an up-to-date perspective on the stock’s performance and outlook.
Read full news article Announcements
Closure of Trading Window
24-Jun-2026 | Source : BSEClosure of Trading Window
Announcement under Regulation 30 (LODR)-Resignation of Director
20-Jun-2026 | Source : BSEAnnouncement under Regulation 30(LODR) for resignation of Mr. Harsh Gandhi Whole Time Director
Announcement under Regulation 30 (LODR)-Cessation
20-Jun-2026 | Source : BSECessation of Harsh Gandhi from the position of Whole Time Director
Corporate Actions

No Upcoming Board Meetings

Chartered Logistics Ltd has declared 10% dividend, ex-date: 25 Oct 11

Chartered Logistics Ltd has announced 1:10 stock split, ex-date: 23 Jun 10

Chartered Logistics Ltd has announced 1:1 bonus issue, ex-date: 24 Dec 10

No Rights history available
Quality key factors
Valuation key factors
Technicals key factors
 Technical Indicator Scale: Bearish, Mildly Bearish, Sideways, Mildly Bullish, Bullish Turned
 Shareholding Snapshot : Mar 2026
Shareholding Compare (%holding)
Non Institution
None
Held by 0 Schemes
Held by 0 FIIs
Lalit Kumar Gandhi (18.13%)
Nisha Kanubhai Makwana (4.51%)
55.46%
Quarterly Results Snapshot (Consolidated) - Mar'26 - QoQ

QoQ Growth in quarter ended Mar 2026 is 1.96% vs -0.06% in Dec 2025
QoQ Growth in quarter ended Mar 2026 is -246.67% vs -408.82% in Dec 2025
Half Yearly Results Snapshot (Standalone) - Sep'25

Growth in half year ended Sep 2025 is -4.68% vs 8.26% in Sep 2024
Growth in half year ended Sep 2025 is 49.07% vs 619.35% in Sep 2024
Nine Monthly Results Snapshot (Standalone) - Dec'25
YoY Growth in nine months ended Dec 2025 is -7.95% vs 13.40% in Dec 2024
YoY Growth in nine months ended Dec 2025 is -41.70% vs 288.00% in Dec 2024
Annual Results Snapshot (Consolidated) - Mar'26
YoY Growth in year ended Mar 2026 is -6.60% vs 6.94% in Mar 2025
YoY Growth in year ended Mar 2026 is -287.10% vs 85.07% in Mar 2025
About Chartered Logistics Ltd

Company Coordinates


