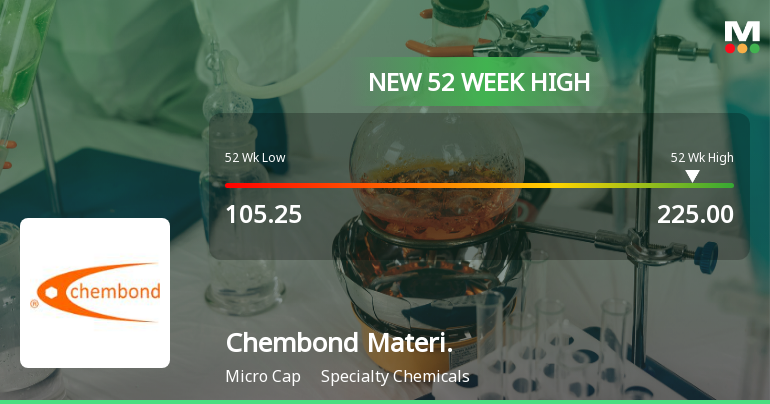
Chembond Materi.

  • Market Cap: Micro Cap
  • Industry: Specialty Chemicals
  • ISIN: INE995D01025
  • NSEID: CHEMBOND
  • BSEID: 530871
INR
231.65
34.9 (17.74%)
BSENSE

Sep 09, 11:01 AM

BSE+NSE Vol: 78.39 k

  • Price Points
  • Score
  • Mojo Parameters
  • Total Return
  • News and Corporate Actions
  • Key factors
  • Shareholding
  • Financials
  • CompanyCV
stock-summaryPrice Point
High/Low

1Day

52 Week

Valuation
Technical
Day's Volume

CASH

78.39 k (747.12%) Volume

Shareholding (Jun 2026)

FII

0.61%

Held by 1 FIIs

DII

1.62%

Held by 0 DIIs

Promoter

68.11%

Why is Chembond Material Technologies Ltd falling/rising?

06-Sep-2026

As of 05-Sep, Chembond Material Technologies Ltd's stock price is at 170.70, down 1.19% and underperforming its sector and the Sensex. The stock has shown a significant decline over the past week and month, with a long-term drop of 53.83%, indicating a downward trend.

As of 05-Sep, Chembond Material Technologies Ltd's stock price is falling, currently at 170.70, which reflects a decrease of 2.05 (-1.19%). The stock has underperformed its sector by 1.57% today. Over the past week, the stock has declined by 2.29%, while the benchmark Sensex has only decreased by 0.97%. Additionally, the stock has shown a negative performance over the past month, down 3.56% compared to a 2.44% decline in the Sensex.<BR><BR>Despite some positive indicators, such as a significant increase in delivery volume by 619.17% against the 5-day average, the stock remains lower than its 5-day, 20-day, and 50-day moving averages, which suggests a short-term downward trend. Furthermore, the stock has experienced a substantial decline over the longer term, with a 3-year drop of 53.83%, contrasting sharply with the Sensex's gain of 16.59% during the same period. This combination of underperformance relative to both the sector and the benchmark, along with the recent price drop, indicates that the stock is currently in a downward trajectory.

View full answer

Who are in the management team of Chembond Materi.?

01-Sep-2026

The management team of Chembond Materi includes Sameer V Shah (Chairman & Managing Director), Nirmal V Shah (Vice Chairman & Managing Director), and several independent directors, along with the Company Secretary, Suchita Singh. This diverse team provides strong leadership and expertise to the company.

The management team of Chembond Materi includes the following individuals:<BR><BR>1. **Sameer V Shah** - Chairman & Managing Director<BR>2. **Nirmal V Shah** - Vice Chairman & Managing Director<BR>3. **Ashwin R Nagarwadia** - Director<BR>4. **Mahendra K Ghelani** - Independent Director<BR>5. **Sushil U Lakhani** - Independent Director<BR>6. **Saraswati Sankar** - Independent Director<BR>7. **Prakash D Trivedi** - Independent Director<BR>8. **Suchita Singh** - Company Secretary & Compliance Officer<BR><BR>This team brings a diverse range of expertise and leadership to the company.

View full answer

What does Chembond Materi. do?

01-Sep-2026

Chembond Material Technologies Ltd manufactures specialty chemicals and reported net sales of 72 Cr and a net profit of 6 Cr for June 2026, with a market cap of INR 234 Cr. The company has a P/E ratio of 15.00 and a dividend yield of 1.14%.

Overview:<BR>Chembond Material Technologies Ltd is engaged in the manufacturing of specialty chemicals and operates within the micro-cap category in the specialty chemicals industry.<BR><BR>History:<BR>The company was initially incorporated as 'Chembond Material Chemicals Limited' in 1975 and changed its name to 'Chembond Material Technologies Limited' effective May 27, 2025. The latest quarterly results reported net sales and net profit for June 2026.<BR><BR>Financial Snapshot:<BR>Net Sales: 72 Cr (Quarterly Results - Jun 2026) <BR>Net Profit: 6 Cr (Quarterly Results - Jun 2026) <BR>Market Cap: INR 234 Cr (Micro Cap)<BR><BR>Key Metrics:<BR>P/E: 15.00 <BR>Industry P/E: 43 <BR>Dividend Yield: 1.14% <BR>Debt Equity: -0.20 <BR>Return on Equity: 8.07% <BR>Price to Book: 1.41 <BR><BR>Contact Details:<BR>Address: Chembond Centre EL-71, Mahape MIDC Navi Mumbai Maharashtra : 400710 <BR>Tel: 91-22-39213000 <BR>Email: info@chembondindia.com <BR>Website: http://www.chembondindia.com

View full answer

Who are the peers of the Chembond Materi.?

01-Sep-2026

Chembond Materi.'s peers include Dynemic Products, Narmada Gelatine, India Gelatine, Dai-ichi Karkari, Diamines & Chem., Indian Toners, Cochin Minerals, Multibase India, and Vikas Ecotech. Narmada Gelatine shows the highest 1-year return at 26.53%, while Vikas Ecotech has the lowest at -46.15%, with Chembond Materi. at -8.68%.

Peers: The peers of Chembond Materi. are Dynemic Products, Narmada Gelatine, India Gelatine, Dai-ichi Karkari, Diamines & Chem., Indian Toners, Cochin Minerals, Multibase India, and Vikas Ecotech.<BR><BR>Quality Snapshot: Excellent management risk is observed at Narmada Gelatine, India Gelatine, and Cochin Minerals, while Good management risk is found at Indian Toners. Average management risk is present at Dynemic Products, Dai-ichi Karkari, Diamines & Chem., and Multibase India, and the rest. Below Average management risk is noted at Vikas Ecotech. Growth is rated as Good for Narmada Gelatine and India Gelatine, while Average growth is seen at Dynemic Products, Dai-ichi Karkari, Diamines & Chem., Indian Toners, and Multibase India, and the rest. Below Average growth is noted at Cochin Minerals and Vikas Ecotech. Capital Structure is Excellent for Narmada Gelatine, India Gelatine, Diamines & Chem., Indian Toners, Chembond Materi., Cochin Minerals, and Multibase India, while Average capital structure is found at Dynemic Products and Dai-ichi Karkari, and Below Average at Vikas Ecotech.<BR><BR>Return Snapshot: The peer with the highest 1-year return is Narmada Gelatine at 26.53%, while Vikas Ecotech has the lowest at -46.15%. Chembond Materi.'s 1-year return of -8.68% is better than Vikas Ecotech's but worse than Narmada Gelatine's. Additionally, peers such as Dynemic Products, Diamines & Chem., Indian Toners, Multibase India, and Vikas Ecotech have negative six-month returns.

View full answer

How big is Chembond Materi.?

01-Sep-2026

As of 31st August, Chembond Material Technologies Ltd has a market capitalization of 234.00 Cr and reported net sales of 264.82 Cr and net profit of 14.63 Cr over the latest four quarters.

As of 31st August, <BR><BR>Market Cap: Chembond Material Technologies Ltd has a market capitalization of 234.00 Cr, classified as a Micro Cap.<BR><BR>Recent Quarterly Performance: The sum of Net Sales for the latest 4 quarters is 264.82 Cr, while the sum of Net Profit for the same period is 14.63 Cr.<BR><BR>Balance Sheet Snapshot: The reporting period is March 2026, with Shareholder's Funds amounting to 166.94 Cr and Total Assets totaling 215.17 Cr.

View full answer

Are Chembond Material Technologies Ltd latest results good or bad?

18-Jul-2026

Chembond Material Technologies Ltd's latest results show strong sales and profit growth, but significant operational challenges and reliance on exceptional income raise concerns about sustainability. Investors should be cautious and monitor future performance closely.

Chembond Material Technologies Ltd's latest results present a mixed picture. On one hand, the company achieved a record net sales figure of ₹72.42 crores for Q1 FY27, marking a 25.55% increase year-on-year and a slight 0.93% increase sequentially. Additionally, net profit surged to ₹5.73 crores, reflecting a substantial 64.66% increase from the previous quarter and a 43.61% rise year-on-year.<BR><BR>However, there are significant concerns regarding the company's operational performance. The operating profit (excluding other income) fell sharply to ₹2.98 crores, a decline of 53.73% from the previous quarter, leading to a steep drop in operating margins to 4.11%, the lowest in seven quarters. This indicates serious operational inefficiencies and rising costs, particularly with employee expenses increasing significantly.<BR><BR>Moreover, the profit growth was heavily reliant on exceptional other income, which accounted for 64.67% of profit before tax, raising questions about the sustainability of these earnings. The company’s return on equity has also declined, suggesting weakening capital efficiency.<BR><BR>In summary, while the headline figures for sales and profit growth appear strong, the underlying operational challenges and reliance on non-operating income cast a shadow over the overall performance. Investors should be cautious and monitor future results closely to assess whether the company can improve its margins and operational efficiency.

View full answer

Should I buy, sell or hold Chembond Material Technologies Ltd?

18-Jul-2026

When is the next results date for Chembond Material Technologies Ltd?

08-Jul-2026

The next results date for Chembond Material Technologies Ltd is July 17, 2026.

The next results date for Chembond Material Technologies Ltd is scheduled for July 17, 2026.

View full answer

How has been the historical performance of Chembond Materi.?

17-Oct-2025

Chembond Materi has experienced significant financial declines, with net sales dropping from INR 461.99 crore in March 2024 to INR 201.30 crore in March 2025, alongside decreases in operating profit, profit before tax, and earnings per share. Total assets decreased slightly, while total liabilities increased, reflecting a challenging financial environment.

Answer:<BR>The historical performance of Chembond Materi shows significant fluctuations in key financial metrics over the years.<BR><BR>Breakdown:<BR>Chembond Materi's net sales have seen a decline from INR 461.99 crore in March 2024 to INR 201.30 crore in March 2025, following a peak of INR 440.44 crore in March 2023. The total operating income mirrored this trend, dropping to INR 201.30 crore in March 2025 from INR 461.99 crore in the previous year. The company's total expenditure also decreased to INR 187.72 crore in March 2025 from INR 412.66 crore in March 2024. Operating profit (PBDIT) fell to INR 21.20 crore in March 2025 from INR 66.59 crore in March 2024, while profit before tax decreased to INR 19.46 crore from INR 59.85 crore. Consequently, profit after tax dropped to INR 17.56 crore in March 2025 from INR 44.31 crore in March 2024. The earnings per share (EPS) also reflected this decline, falling to INR 8.58 in March 2025 from INR 21.71 in March 2024. On the balance sheet, total assets decreased to INR 198.71 crore in March 2025 from INR 189.58 crore in March 2024, while total liabilities increased slightly to INR 198.71 crore from INR 189.58 crore. The cash flow from operating activities also declined to INR 19.00 crore in March 2025 from INR 94.00 crore in March 2024, indicating a challenging financial environment for the company.

View full answer

Is Chembond Materi. overvalued or undervalued?

03-Oct-2025

As of October 1, 2025, Chembond Material is considered very attractive and undervalued with a PE ratio of 10.42, an EV to EBITDA ratio of 8.62, and a ROCE of 16.85%, especially when compared to peers like Solar Industries and Gujarat Fluorochemicals, despite a year-to-date stock decline of 69.76%.

As of 1 October 2025, the valuation grade for Chembond Material has moved from attractive to very attractive, indicating a significant improvement in its perceived value. The company is currently considered undervalued, with a PE ratio of 10.42, an EV to EBITDA ratio of 8.62, and a ROCE of 16.85%. <BR><BR>In comparison to its peers, Chembond's valuation metrics stand out, particularly against Solar Industries, which has a PE ratio of 96.75, and Gujarat Fluorochemicals with a PE of 65.59, both categorized as very expensive. The company's PEG ratio of 0.00 further emphasizes its undervaluation relative to the market. Despite recent stock performance showing a decline of 69.76% year-to-date compared to a 3.64% rise in the Sensex, the current valuation suggests a strong potential for recovery and growth.

View full answer

Who are the top shareholders of the Chembond Materi.?

17-Jul-2025

The top shareholders of Chembond Materi include promoter Nirmal Vinod Shah with 13.35%, two Foreign Institutional Investors holding 0.61%, and public shareholder Ajay Chinubhai Laloo with 2.04%. Individual investors collectively own 25.02%, with no pledged promoter holdings or mutual fund investments.

The top shareholders of Chembond Materi include the promoters, with Nirmal Vinod Shah holding the highest stake at 13.35%. Additionally, there are two Foreign Institutional Investors (FIIs) who collectively hold 0.61% of the shares. The highest public shareholder is Ajay Chinubhai Laloo, with a stake of 2.04%. Individual investors collectively hold 25.02% of the company. Notably, there are no pledged promoter holdings and no mutual funds currently invested in the company.

View full answer

What is the technical trend for Chembond Chem.?

09-Jun-2025

As of May 9, 2025, Chembond Chem. is in a bearish trend with moderate strength, indicated by daily moving averages and weekly MACD, despite a bullish weekly RSI, and has underperformed compared to the Sensex over the past month and year.

As of 9 May 2025, the technical trend for Chembond Chem. has changed from mildly bearish to bearish. The current stance is bearish with moderate strength, driven primarily by the daily moving averages indicating a bearish trend and the weekly MACD also showing bearish momentum. The weekly KST and Bollinger Bands further support this bearish outlook. Although the weekly RSI is bullish, it is overshadowed by the overall bearish signals from other indicators. The stock's recent performance has been significantly underwhelming compared to the Sensex, particularly over the past month and year.

View full answer

What is the bonus history of the Chembond Chem.?

06-Jun-2025

Chembond Chemicals Ltd has a bonus history that includes a 1:1 bonus issue announced on March 10, 2010, with a record date of March 11, 2010, allowing shareholders to receive one additional share for each share held.

Chembond Chemicals Ltd has a bonus history that includes a notable 1:1 bonus issue. This was announced with an ex-date of March 10, 2010, and the record date was March 11, 2010. This means that shareholders received one additional share for every share they held on the record date. If you have any more questions about the company or its financials, feel free to ask!

View full answer

Has Chembond Chem. declared dividend?

06-Jun-2025

Chembond Chemicals Ltd has declared a 70% dividend, amounting to ₹3.5 per share, with an ex-date of July 22, 2024. The dividend yield is 1.4%, but total returns have shown significant volatility, with negative returns in the short term and positive returns over the longer term.

Chembond Chemicals Ltd has declared a 70% dividend.<BR><BR>Dividend Details:<BR>- Percentage announced: 70%<BR>- Amount per share: 3.5<BR>- Ex-date: Jul-22-2024<BR><BR>Dividend Yield: 1.4%<BR><BR>Total Returns by Period:<BR>In the last 6 months, the price return was -56.01%, with no dividend return, resulting in a total return of -56.01%.<BR><BR>Over the past year, the price return was -50.14%, with a dividend return of 0.69%, leading to a total return of -49.45%.<BR><BR>In the 2-year period, the price return was -35.49%, while the dividend return was 1.57%, culminating in a total return of -33.92%.<BR><BR>For the 3-year period, the price return was 56.54%, with a dividend return of 7.32%, resulting in a total return of 63.86%.<BR><BR>In the last 4 years, the price return was 27.25%, the dividend return was 6.87%, and the total return was 34.12%.<BR><BR>Over the past 5 years, the price return was 80.42%, with a dividend return of 10.01%, leading to a total return of 90.43%.<BR><BR>Overall, while Chembond Chemicals Ltd has declared a dividend, the total returns over various periods show significant volatility, with negative returns in the shorter terms but positive returns over the longer term. The dividend yield of 1.4% indicates a modest return from dividends relative to the stock price.

View full answer
iScoreScore
Click here to find our call on this stock
Strong Sell
Sell
Hold
Buy
Strong Buy

Dashboard

1

The company is Net-Debt Free

 
2

Poor long term growth as Net Sales has grown by an annual rate of -2.62% and Operating profit at -3.92% over the last 5 years

 
3

Positive results in Jun 26

4

With ROE of 8.1, it has a Very Expensive valuation with a 1.6 Price to Book Value

5

Increasing Participation by Institutional Investors

6

Market Beating Performance

stock-summaryMojo Parameters

Mojo Parameters

Loading Valuation Snapshot...

Stock DNA

stock-summary
Industry

Specialty Chemicals

stock-summary
Market cap

INR 312 Cr (Micro Cap)

stock-summary
P/E

18.00

stock-summary
Industry P/E

18

stock-summary
Dividend Yield

1.01%

stock-summary
Debt Equity

-0.20

stock-summary
Return on Equity

8.07%

stock-summary
Price to Book

1.60

Revenue and Profits:
Net Sales:
72 Cr
(Quarterly Results - Jun 2026)
Net Profit:
6 Cr
stock-summaryTotal Returns
Total Returns (Price + Dividend) stock-summary
Dividend Yield (1.01%)
TimePeriod
Price Return
Dividend Return
Total Return
3 Months
45.14%
1.26%
46.4%
6 Months
68.53%
1.43%
69.96%
1 Year
28.69%
1.10%
29.79%
2 Years
-57.19%
0.70%
-56.49%
3 Years
-34.76%
2.08%
-32.68%
4 Years
36.97%
5.89%
42.86%
5 Years
17.02%
6.71%
23.73%

Latest dividend: 2 per share ex-dividend date: Jul-02-2026

Risk Adjusted Returns v/s stock-summary
Returns Beta
Icon
Beta has not been calculated since enough price history is not available
stock-summaryNews & Corporate Actions

Announcements stock-summary

Disclosures under Reg. 29(2) of SEBI (SAST) Regulations 2011

07-Sep-2026 | Source : BSE

The Exchange has received the disclosure under Regulation 29(2) of SEBI (Substantial Acquisition of Shares & Takeovers) Regulations 2011 for Raunaq Sameer Shah

Announcement under Regulation 30 (LODR)-Credit Rating

01-Sep-2026 | Source : BSE

Intimation of Credit Rating Information under Regulation 30 of SEBI (Listing Obligation and Disclosure Requirements) Regulations 2015

Announcement under Regulation 30 (LODR)-Newspaper Publication

19-Jul-2026 | Source : BSE

Submission of newspaper advertisement - Quarterly Financial Results of the Company for the Quarter Ended June 30 2026

Corporate Actions stock-summary

stock-summary
BOARD MEETING

No Upcoming Board Meetings

stock-summary
DIVIDEND

Chembond Material Technologies Ltd has declared 40% dividend, ex-date: 02 Jul 26

stock-summary
SPLITS

Chembond Material Technologies Ltd has announced 5:10 stock split, ex-date: 06 Sep 16

stock-summary
BONUS

Chembond Material Technologies Ltd has announced 1:1 bonus issue, ex-date: 10 Mar 10

stock-summary
RIGHTS

No Rights history available

stock-summaryKey Factors

Quality key factors stock-summary

Factor
Value
Sales Growth (5y)
-2.62%
EBIT Growth (5y)
-3.92%
EBIT to Interest (avg)
18.55
Debt to EBITDA (avg)
0.23
Net Debt to Equity (avg)
-0.20
Sales to Capital Employed (avg)
1.34
Tax Ratio
8.45%
Dividend Payout Ratio
13.40%
Pledged Shares
0
Institutional Holding
2.23%
ROCE (avg)
11.07%
ROE (avg)
11.62%

Valuation key factors

Factor
Value
P/E Ratio
18
Industry P/E
18
Price to Book Value
1.60
EV to EBIT
16.83
EV to EBITDA
13.28
EV to Capital Employed
1.75
EV to Sales
0.88
PEG Ratio
NA
Dividend Yield
1.01%
ROCE (Latest)
10.92%
ROE (Latest)
8.07%

Technicals key factors

Indicator
Weekly
Monthly
MACD
Bullish
Mildly Bullish
RSI
No Signal
No Signal
Bollinger Bands
Bullish
Mildly Bearish
Moving Averages
Bullish (Daily)
KST
Mildly Bearish
Mildly Bullish
Dow Theory
Mildly Bullish
No Trend
OBV
Mildly Bullish
Mildly Bullish
stock-summary Technical Indicator Scale: Bearish, Mildly Bearish, Sideways, Mildly Bullish, Bullish  Turned 
stock-summaryShareholding
Shareholding Snapshot : Jun 2026stock-summary
Shareholding Compare (%holding) stock-summary
Majority shareholders

Promoters

Pledged Promoter Holdings

None

Mutual Funds

Held by 0 Schemes

FIIs

Held by 1 FIIs (0.61%)

Promoter with highest holding

Sameer Vinod Shah (27.36%)

Highest Public shareholder

Ajay Chinubhai Laloo (2.03%)

Individual Investors Holdings

24.9%

stock-summaryFinancial
[
  {
    "link": "quarterly",
    "btn_text": "All Quarterly Results",
    "header": "Quarterly Results Snapshot (Consolidated) - Jun'26 - QoQ",
    "rhs": [
      {
        "prefix": "Net Sales ",
        "suffix": "QoQ Growth in quarter ended Jun 2026 is 0.93% vs 14.07% in Mar 2026",
        "dir": -1
      },
      {
        "prefix": "Consolidated Net Profit ",
        "suffix": "QoQ Growth in quarter ended Jun 2026 is 64.66% vs 118.87% in Mar 2026",
        "dir": -1
      }
    ],
    "table": {
      "header": [
        "Jun'26",
        "Mar'26",
        "Change(%)"
      ],
      "body": [
        {
          "field": "Net Sales",
          "val1": "72.42",
          "val2": "71.75",
          "chgp": "0.93%",
          "chgp_class": "positive"
        },
        {
          "field": "Operating Profit (PBDIT) excl Other Income",
          "val1": "2.98",
          "val2": "6.44",
          "chgp": "-53.73%",
          "chgp_class": "negative"
        },
        {
          "field": "Interest",
          "val1": "0.06",
          "val2": "0.07",
          "chgp": "-14.29%",
          "chgp_class": "positive"
        },
        {
          "field": "Exceptional Items",
          "val1": "0.00",
          "val2": "0.47",
          "chgp": "-100.00%",
          "chgp_class": "negative"
        },
        {
          "field": "Consolidate Net Profit",
          "val1": "5.73",
          "val2": "3.48",
          "chgp": "64.66%",
          "chgp_class": "positive"
        },
        {
          "field": "Operating Profit Margin (Excl OI)",
          "val1": "4.11%",
          "val2": "8.98%",
          "chgp": "-4.87%",
          "chgp_class": "negative"
        }
      ]
    }
  },
  {
    "link": "half-yearly",
    "btn_text": "All Half Yearly Results",
    "header": "Half Yearly Results Snapshot (Consolidated) - Sep'25",
    "rhs": [
      {
        "prefix": "Net Sales ",
        "suffix": " Growth in half year ended Sep 2025 is 20.19% vs -57.42% in Sep 2024",
        "dir": 1
      },
      {
        "prefix": "Consolidated Net Profit ",
        "suffix": " Growth in half year ended Sep 2025 is -28.71% vs -54.67% in Sep 2024",
        "dir": 1
      }
    ],
    "table": {
      "header": [
        "Sep'25",
        "Sep'24",
        "Change(%)"
      ],
      "body": [
        {
          "field": "Net Sales",
          "val1": "115.43",
          "val2": "96.04",
          "chgp": "20.19%",
          "chgp_class": "positive"
        },
        {
          "field": "Operating Profit (PBDIT) excl Other Income",
          "val1": "7.49",
          "val2": "6.22",
          "chgp": "20.42%",
          "chgp_class": "positive"
        },
        {
          "field": "Interest",
          "val1": "0.17",
          "val2": "0.32",
          "chgp": "-46.88%",
          "chgp_class": "positive"
        },
        {
          "field": "Exceptional Items",
          "val1": "0.00",
          "val2": "1.55",
          "chgp": "-100.00%",
          "chgp_class": "negative"
        },
        {
          "field": "Consolidate Net Profit",
          "val1": "7.82",
          "val2": "10.97",
          "chgp": "-28.71%",
          "chgp_class": "negative"
        },
        {
          "field": "Operating Profit Margin (Excl OI)",
          "val1": "6.49%",
          "val2": "6.48%",
          "chgp": "0.01%",
          "chgp_class": "positive"
        }
      ]
    }
  },
  {
    "link": "nine-monthly",
    "btn_text": "All Nine Monthly Results",
    "header": "Nine Monthly Results Snapshot (Consolidated) - Dec'25",
    "rhs": [
      {
        "prefix": "Net Sales ",
        "suffix": "YoY Growth in nine months ended Dec 2025 is 19.61% vs -56.17% in Dec 2024",
        "dir": 1
      },
      {
        "prefix": "Consolidated Net Profit ",
        "suffix": "YoY Growth in nine months ended Dec 2025 is -33.78% vs -62.31% in Dec 2024",
        "dir": 1
      }
    ],
    "table": {
      "header": [
        "Dec'25",
        "Dec'24",
        "Change(%)"
      ],
      "body": [
        {
          "field": "Net Sales",
          "val1": "178.33",
          "val2": "149.09",
          "chgp": "19.61%",
          "chgp_class": "positive"
        },
        {
          "field": "Operating Profit (PBDIT) excl Other Income",
          "val1": "11.64",
          "val2": "9.99",
          "chgp": "16.52%",
          "chgp_class": "positive"
        },
        {
          "field": "Interest",
          "val1": "0.30",
          "val2": "0.50",
          "chgp": "-40.00%",
          "chgp_class": "positive"
        },
        {
          "field": "Exceptional Items",
          "val1": "-1.80",
          "val2": "1.55",
          "chgp": "-216.13%",
          "chgp_class": "negative"
        },
        {
          "field": "Consolidate Net Profit",
          "val1": "9.41",
          "val2": "14.21",
          "chgp": "-33.78%",
          "chgp_class": "negative"
        },
        {
          "field": "Operating Profit Margin (Excl OI)",
          "val1": "6.53%",
          "val2": "6.70%",
          "chgp": "-0.17%",
          "chgp_class": "negative"
        }
      ]
    }
  },
  {
    "link": "annual",
    "btn_text": "All Annual Results",
    "header": "Annual Results Snapshot (Consolidated) - Mar'26",
    "rhs": [
      {
        "prefix": "Net Sales ",
        "suffix": "YoY Growth in year ended Mar 2026 is 24.23% vs -56.43% in Mar 2025",
        "dir": 1
      },
      {
        "prefix": "Consolidated Net Profit ",
        "suffix": "YoY Growth in year ended Mar 2026 is -26.59% vs -60.46% in Mar 2025",
        "dir": 1
      }
    ],
    "table": {
      "header": [
        "Mar'26",
        "Mar'25",
        "Change(%)"
      ],
      "body": [
        {
          "field": "Net Sales",
          "val1": "250.07",
          "val2": "201.30",
          "chgp": "24.23%",
          "chgp_class": "positive"
        },
        {
          "field": "Operating Profit (PBDIT) excl Other Income",
          "val1": "18.07",
          "val2": "13.58",
          "chgp": "33.06%",
          "chgp_class": "positive"
        },
        {
          "field": "Interest",
          "val1": "0.37",
          "val2": "0.64",
          "chgp": "-42.19%",
          "chgp_class": "positive"
        },
        {
          "field": "Exceptional Items",
          "val1": "-1.32",
          "val2": "1.55",
          "chgp": "-185.16%",
          "chgp_class": "negative"
        },
        {
          "field": "Consolidate Net Profit",
          "val1": "12.89",
          "val2": "17.56",
          "chgp": "-26.59%",
          "chgp_class": "negative"
        },
        {
          "field": "Operating Profit Margin (Excl OI)",
          "val1": "7.23%",
          "val2": "6.75%",
          "chgp": "0.48%",
          "chgp_class": "positive"
        }
      ]
    }
  }
]

Quarterly Results Snapshot (Consolidated) - Jun'26 - QoQstock-summary

Jun'26
Mar'26
Change(%)
Net Sales
72.42
71.75
0.93%
Operating Profit (PBDIT) excl Other Income
2.98
6.44
-53.73%
Interest
0.06
0.07
-14.29%
Exceptional Items
0.00
0.47
-100.00%
Consolidate Net Profit
5.73
3.48
64.66%
Operating Profit Margin (Excl OI)
4.11%
8.98%
-4.87%
Values in Rs Cr.
Direction Arrows
Net Sales

QoQ Growth in quarter ended Jun 2026 is 0.93% vs 14.07% in Mar 2026

Direction Arrows
Consolidated Net Profit

QoQ Growth in quarter ended Jun 2026 is 64.66% vs 118.87% in Mar 2026

Half Yearly Results Snapshot (Consolidated) - Sep'25stock-summary

Sep'25
Sep'24
Change(%)
Net Sales
115.43
96.04
20.19%
Operating Profit (PBDIT) excl Other Income
7.49
6.22
20.42%
Interest
0.17
0.32
-46.88%
Exceptional Items
0.00
1.55
-100.00%
Consolidate Net Profit
7.82
10.97
-28.71%
Operating Profit Margin (Excl OI)
6.49%
6.48%
0.01%
Values in Rs Cr.
Direction Arrows
Net Sales

Growth in half year ended Sep 2025 is 20.19% vs -57.42% in Sep 2024

Direction Arrows
Consolidated Net Profit

Growth in half year ended Sep 2025 is -28.71% vs -54.67% in Sep 2024

Nine Monthly Results Snapshot (Consolidated) - Dec'25stock-summary

Dec'25
Dec'24
Change(%)
Net Sales
178.33
149.09
19.61%
Operating Profit (PBDIT) excl Other Income
11.64
9.99
16.52%
Interest
0.30
0.50
-40.00%
Exceptional Items
-1.80
1.55
-216.13%
Consolidate Net Profit
9.41
14.21
-33.78%
Operating Profit Margin (Excl OI)
6.53%
6.70%
-0.17%
Values in Rs Cr.
Direction Arrows
Net Sales

YoY Growth in nine months ended Dec 2025 is 19.61% vs -56.17% in Dec 2024

Direction Arrows
Consolidated Net Profit

YoY Growth in nine months ended Dec 2025 is -33.78% vs -62.31% in Dec 2024

Annual Results Snapshot (Consolidated) - Mar'26stock-summary

Mar'26
Mar'25
Change(%)
Net Sales
250.07
201.30
24.23%
Operating Profit (PBDIT) excl Other Income
18.07
13.58
33.06%
Interest
0.37
0.64
-42.19%
Exceptional Items
-1.32
1.55
-185.16%
Consolidate Net Profit
12.89
17.56
-26.59%
Operating Profit Margin (Excl OI)
7.23%
6.75%
0.48%
Values in Rs Cr.
Direction Arrows
Net Sales

YoY Growth in year ended Mar 2026 is 24.23% vs -56.43% in Mar 2025

Direction Arrows
Consolidated Net Profit

YoY Growth in year ended Mar 2026 is -26.59% vs -60.46% in Mar 2025

stock-summaryCompany CV
About Chembond Material Technologies Ltd stock-summary
stock-summary
Chembond Material Technologies Ltd
Micro Cap
Specialty Chemicals
Chembond Material Technologies Limited was initially incorporated as 'Chembond Material Chemicals Limited' in 1975. The name has changed to 'Chembond Material Technologies Limited' with effect from May 27, 2025, pursuant to the Composite Scheme of Arrangement. Company is engaged in manufacturing of Speciality Chemicals. The Company holds 49% interest in Chembond Enzyme Company Ltd, which supplies industrial enzymes for applications in textile, animal health and alcohol production.
Company Coordinates stock-summary
Company Details
Chembond Centre EL-71, Mahape MIDC Navi Mumbai Maharashtra : 400710
stock-summary
Tel: 91-22-39213000
stock-summary
info@chembondindia.com
Registrar Details
TSR Darashaw Ltd, 6-10 , Haji Moosa Patrawala Indl. Est , 20 Dr.E.Moses Road , Mahalaxmi , Mumbai