
Compare Chembond Materi. with Similar Stocks
Dashboard
The company is Net-Debt Free
Poor long term growth as Net Sales has grown by an annual rate of -1.97% and Operating profit at -1.31% over the last 5 years
Positive results in Mar 26
With ROE of 8.1, it has a Very Expensive valuation with a 1.4 Price to Book Value
Majority shareholders : Promoters
Underperformed the market in the last 1 year
Stock DNA
Specialty Chemicals
INR 249 Cr (Micro Cap)
18.00
45
2.09%
-0.20
8.07%
1.45
Total Returns (Price + Dividend) 
Latest dividend: 2.007142857142857 per share ex-dividend date: Jul-02-2026
Risk Adjusted Returns v/s
Returns Beta

News
When is the next results date for Chembond Material Technologies Ltd?
The next results date for Chembond Material Technologies Ltd is scheduled for July 17, 2026....
Read full news article
Chembond Material Technologies Ltd is Rated Hold
Chembond Material Technologies Ltd is rated 'Hold' by MarketsMOJO, with this rating last updated on 15 June 2026. However, the analysis and financial metrics discussed here reflect the stock's current position as of 08 July 2026, providing investors with an up-to-date view of its fundamentals, valuation, financial trend, and technical outlook.
Read full news article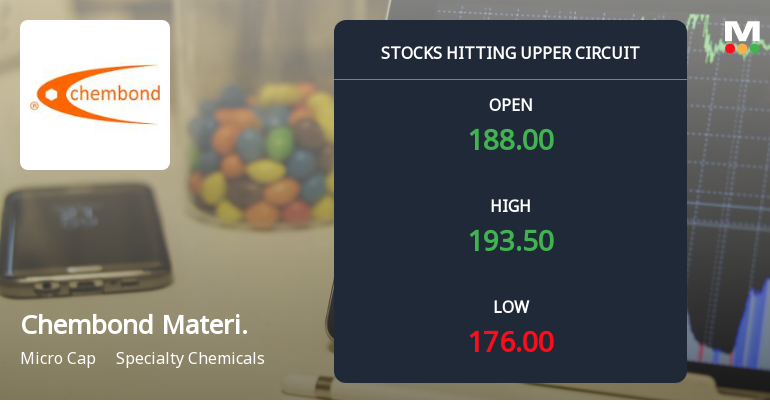
Chembond Material Technologies Ltd Locks at Upper Circuit With 5% Gain — Buyers Queue, Sellers Absent
At Rs 192.67, the buying was done — not because demand dried up, but because the exchange wouldn't let the stock go any higher. Chembond Material Technologies Ltd locked at its upper circuit of 5.0% on 6 Jul 2026, with buyers queuing and no sellers willing to part with shares.
Read full news article Announcements
Corporate Actions

17 Jul 2026

Chembond Material Technologies Ltd has declared 40% dividend, ex-date: 02 Jul 26

Chembond Material Technologies Ltd has announced 5:10 stock split, ex-date: 06 Sep 16

Chembond Material Technologies Ltd has announced 1:1 bonus issue, ex-date: 10 Mar 10

No Rights history available
Quality key factors
Valuation key factors
Technicals key factors
 Technical Indicator Scale: Bearish, Mildly Bearish, Sideways, Mildly Bullish, Bullish Turned
 Shareholding Snapshot : Mar 2026
Shareholding Compare (%holding)
Promoters
None
Held by 0 Schemes
Held by 1 FIIs (0.61%)
Sameer Vinod Shah (27.36%)
Ajay Chinubhai Laloo (2.04%)
25.75%
Quarterly Results Snapshot (Consolidated) - Mar'26 - QoQ

QoQ Growth in quarter ended Mar 2026 is 14.07% vs 8.92% in Dec 2025
QoQ Growth in quarter ended Mar 2026 is 118.87% vs -58.49% in Dec 2025
Half Yearly Results Snapshot (Consolidated) - Sep'25
Growth in half year ended Sep 2025 is 20.19% vs -57.42% in Sep 2024
Growth in half year ended Sep 2025 is -28.71% vs -54.67% in Sep 2024
Nine Monthly Results Snapshot (Consolidated) - Dec'25
YoY Growth in nine months ended Dec 2025 is 19.61% vs -56.17% in Dec 2024
YoY Growth in nine months ended Dec 2025 is -33.78% vs -62.31% in Dec 2024
Annual Results Snapshot (Consolidated) - Mar'26
YoY Growth in year ended Mar 2026 is 24.23% vs -56.43% in Mar 2025
YoY Growth in year ended Mar 2026 is -26.59% vs -60.46% in Mar 2025
About Chembond Material Technologies Ltd

Company Coordinates


