
Compare Chemcon Special. with Similar Stocks
Dashboard
Weak Long Term Fundamental Strength with a -24.29% CAGR growth in Operating Profits over the last 5 years
- The company has been able to generate a Return on Equity (avg) of 9.70% signifying low profitability per unit of shareholders funds
With ROE of 4.6, it has a Very Expensive valuation with a 1.4 Price to Book Value
Despite the size of the company, domestic mutual funds hold only 0% of the company
Stock DNA
Specialty Chemicals
INR 744 Cr (Micro Cap)
30.00
42
3.15%
-0.23
4.60%
1.47
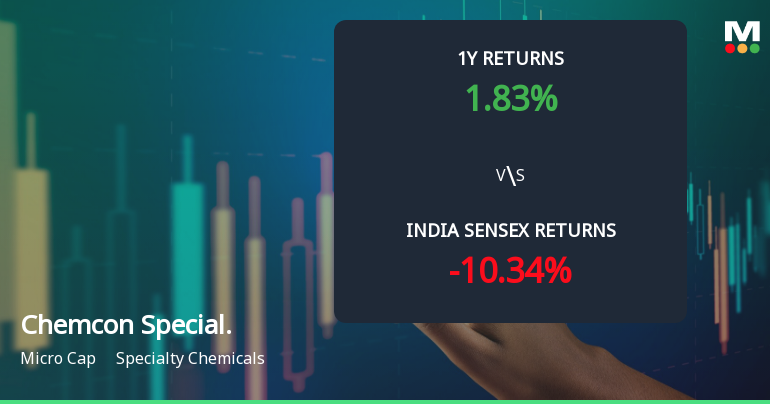
Total Returns (Price + Dividend) 
Latest dividend: 6.5 per share ex-dividend date: May-27-2026
Risk Adjusted Returns v/s
Returns Beta

News
Chemcon Speciality Chemicals Ltd Sees Technical Momentum Shift Amid Mixed Indicator Signals
Chemcon Speciality Chemicals Ltd has exhibited a notable shift in price momentum, moving from a sideways trend to a mildly bullish stance, supported by a blend of technical indicators that present a nuanced outlook for investors. Despite a recent upgrade from a Strong Sell to a Sell rating, the micro-cap specialty chemicals firm’s technical landscape reveals both encouraging and cautionary signals as it navigates volatile market conditions.
Read full news article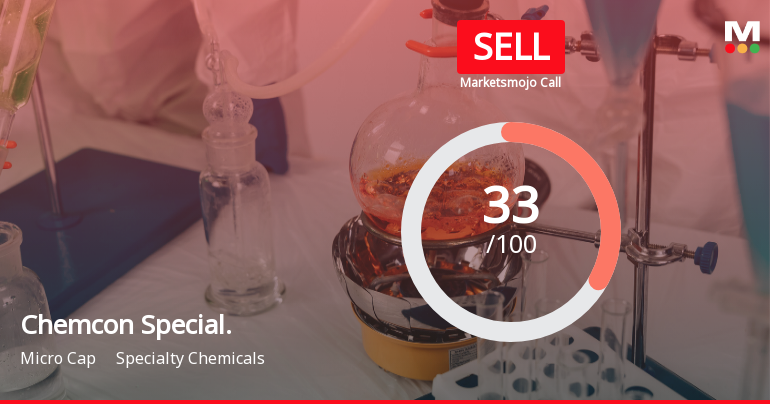
Chemcon Speciality Chemicals Ltd Upgraded to Sell on Technical Improvements and Valuation Concerns
Chemcon Speciality Chemicals Ltd has seen its investment rating upgraded from Strong Sell to Sell as of 5 June 2026, driven primarily by a shift in technical indicators. Despite this improvement, the company remains burdened by a very expensive valuation and weak long-term financial fundamentals, leaving investors cautious amid mixed signals.
Read full news article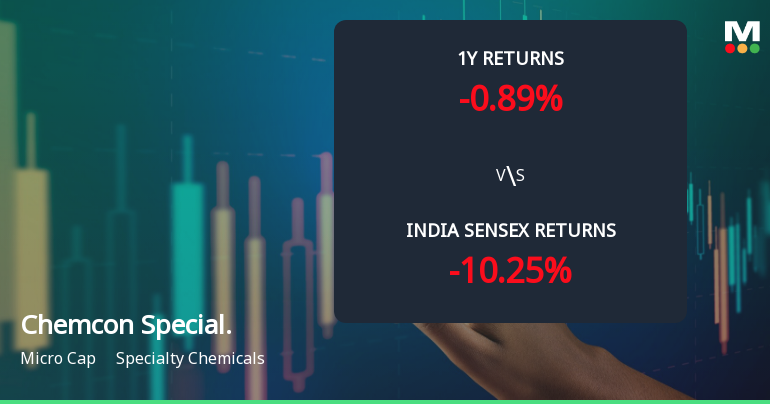
Chemcon Speciality Chemicals Ltd Sees Technical Momentum Shift Amid Mixed Market Signals
Chemcon Speciality Chemicals Ltd has experienced a notable shift in its technical momentum, moving from a mildly bearish stance to a sideways trend. Despite a strong intraday rally pushing the stock price up by 13.25% to ₹207.65, the overall technical indicators present a mixed picture, reflecting both bullish and bearish signals across different timeframes.
Read full news article Announcements
Compliances-Reg.24(A)-Annual Secretarial Compliance
26-May-2026 | Source : BSEAnnual Secretarial Compliance Report
Announcement under Regulation 30 (LODR)-Investor Presentation
22-May-2026 | Source : BSEInvestor Presentation - May 2026
Announcement under Regulation 30 (LODR)-Newspaper Publication
22-May-2026 | Source : BSENewspaper Publication
Corporate Actions

No Upcoming Board Meetings

Chemcon Speciality Chemicals Ltd has declared 65% dividend, ex-date: 27 May 26

No Splits history available

No Bonus history available

No Rights history available
Quality key factors
Valuation key factors
Technicals key factors
 Technical Indicator Scale: Bearish, Mildly Bearish, Sideways, Mildly Bullish, Bullish Turned
 Shareholding Snapshot : Mar 2026
Shareholding Compare (%holding)
Promoters
None
Held by 0 Schemes
Held by 6 FIIs (0.38%)
Kamalkumar Rajendra Aggarwal (27.81%)
None
22.85%
Quarterly Results Snapshot (Standalone) - Mar'26 - QoQ

QoQ Growth in quarter ended Mar 2026 is 31.55% vs 6.74% in Dec 2025
QoQ Growth in quarter ended Mar 2026 is 25.15% vs -11.48% in Dec 2025
Half Yearly Results Snapshot (Standalone) - Sep'25
Growth in half year ended Sep 2025 is 9.28% vs -36.50% in Sep 2024
Growth in half year ended Sep 2025 is 3.68% vs -1.27% in Sep 2024
Nine Monthly Results Snapshot (Standalone) - Dec'25
YoY Growth in nine months ended Dec 2025 is 7.90% vs -26.50% in Dec 2024

YoY Growth in nine months ended Dec 2025 is -16.04% vs 25.91% in Dec 2024
Annual Results Snapshot (Standalone) - Mar'26
YoY Growth in year ended Mar 2026 is 15.71% vs -22.35% in Mar 2025
YoY Growth in year ended Mar 2026 is -3.48% vs 27.41% in Mar 2025
About Chemcon Speciality Chemicals Ltd

Company Coordinates


