DMCC Speciality

  • Market Cap: Micro Cap
  • Industry: Specialty Chemicals
  • ISIN: INE505A01010
  • NSEID: DMCC
  • BSEID: 506405
INR
288.00
-3.05 (-1.05%)
BSENSE

Aug 20, 03:13 PM

BSE+NSE Vol: 19.82 k

  • Price Points
  • Score
  • Mojo Parameters
  • Total Return
  • News and Corporate Actions
  • Key factors
  • Shareholding
  • Financials
  • CompanyCV
stock-summaryPrice Point
High/Low

1Day

52 Week

Valuation
Technical
Day's Volume

CASH

19.82 k (-66.98%) Volume

Shareholding (Jun 2026)

FII

0.15%

Held by 2 FIIs

DII

1.50%

Held by 1 DIIs

Promoter

53.84%

Why is DMCC Speciality Chemicals Ltd falling/rising?

20-Aug-2026

As of 19-Aug, DMCC Speciality Chemicals Ltd's stock price is rising to 293.55, indicating a potential recovery in investor sentiment after a trend reversal. Despite a significant drop in investor participation, the stock's performance today shows it is gaining traction compared to its sector and is positioned favorably against longer-term moving averages.

As of 19-Aug, DMCC Speciality Chemicals Ltd's stock price is rising, currently at 293.55, with a change of 4.85 (1.68%) upwards. This increase follows a trend reversal after three consecutive days of decline, indicating a potential recovery in investor sentiment. Additionally, the stock has outperformed its sector by 2.95% today, suggesting that it is gaining traction compared to its peers.<BR><BR>Despite a recent intraday low of Rs 281, which represented a decline of 2.67%, the overall performance today reflects a positive shift. The stock is trading higher than its 20-day, 50-day, 100-day, and 200-day moving averages, although it is lower than its 5-day moving average. This indicates that while there has been some short-term volatility, the longer-term trend remains favorable.<BR><BR>However, it is important to note that there has been a significant drop in investor participation, with delivery volume falling by 65.08% against the 5-day average. This decline in trading activity could suggest caution among investors, but the current rise in stock price indicates a momentary rebound in interest or confidence in the stock. Overall, the combination of a trend reversal, sector outperformance, and the stock's positioning relative to moving averages contributes to the current rise in DMCC Speciality Chemicals Ltd's stock price.

View full answer

Should I buy, sell or hold DMCC Speciality Chemicals Ltd?

17-Aug-2026

Who are in the management team of DMCC Speciality?

14-Aug-2026

The management team of DMCC Speciality includes Chairman Laxmikumar N Goculdas, Whole-time Director Dilip Trimbak Gokhale, Vice Chairperson Mitika Laxmikumar Goculdas, and several independent directors, with Bimal L Goculdas serving as Managing Director & CEO. They oversee the company's strategic direction and governance.

The management team of DMCC Speciality includes the following members:<BR><BR>1. **Laxmikumar N Goculdas** - Chairman (Non-Executive)<BR>2. **Dilip Trimbak Gokhale** - Whole-time Director<BR>3. **M T Ankleshwaria** - Independent Director<BR>4. **Mitika Laxmikumar Goculdas** - Vice Chairperson<BR>5. **Sanjeev Vishwanath Joshi** - Independent Director<BR>6. **Mukul Manoharlal Taly** - Independent Director<BR>7. **Bimal L Goculdas** - Managing Director & CEO<BR>8. **Janaki Ashwin Patwardhan** - Independent Director<BR>9. **Omkar Chandrakant Mhamunkar** - Company Secretary & Compliance Officer<BR><BR>This team is responsible for the strategic direction and governance of the company.

View full answer

What does DMCC Speciality do?

14-Aug-2026

DMCC Speciality Chemicals Ltd, a micro-cap company founded in 1919, operates in the specialty chemicals industry and reported net sales of 253 Cr and a net profit of 20 Cr for June 2026. The company has a market cap of INR 751 Cr and key metrics include a P/E of 19.00 and a dividend yield of 0.83%.

Overview: <BR>DMCC Speciality Chemicals Ltd operates in the specialty chemicals industry and is classified as a micro-cap company.<BR><BR>History: <BR>The company was incorporated in 1919 as 'Dharamsi Morarji Chemicals Company Limited' and changed its name to 'DMCC Speciality Chemicals Limited' on August 12, 2022. The latest quarterly results reported net sales and net profit for June 2026.<BR><BR>Financial Snapshot: <BR>Net Sales: 253 Cr (Quarterly Results - Jun 2026) <BR>Net Profit: 20 Cr (Quarterly Results - Jun 2026) <BR>Market Cap: INR 751 Cr (Micro Cap)<BR><BR>Key Metrics: <BR>P/E: 19.00 <BR>Industry P/E: 44 <BR>Dividend Yield: 0.83% <BR>Debt-Equity: 0.33 <BR>Return on Equity: 11.01% <BR>Price to Book: 3.02<BR><BR>Contact Details: <BR>Address: Prospect Chambers, 317/21 Dr D N Road Fort Mumbai Maharashtra : 400001 <BR>Tel: 91-22-22048881/2/3 <BR>Email: dgokhale@dmcc.com <BR>Website: http://www.dmcc.com

View full answer

Who are the peers of the DMCC Speciality?

14-Aug-2026

DMCC Speciality's peers include Valiant Organics, Amal, Fairchem Organic, and others, with varying management risks and growth rates. Notably, Chembond Chemic. leads in 1-year returns at 50.46%, while DMCC Speciality has a return of -8.92%.

Peers: The peers of DMCC Speciality are Valiant Organics, Amal, Fairchem Organic, Gem Aromatics, Sudarshan Pharma, Chembond Chemic., Chemcon Special., Jayant Agro Org., Kronox Lab, and Black Rose Indus.<BR><BR>Quality Snapshot: Excellent management risk is observed at Sudarshan Pharma, while Average management risk is found at Amal, Fairchem Organic, Gem Aromatics, DMCC Speciality, Chembond Chemic., Jayant Agro Org., and Kronox Lab, and the rest. Growth is Excellent at Sudarshan Pharma, Good at Amal and Fairchem Organic, and Average at DMCC Speciality, Chembond Chemic., Jayant Agro Org., and the rest, while Below Average is seen at Valiant Organics, Gem Aromatics, and the rest. Capital Structure is Excellent at Chembond Chemic., Chemcon Special., and Kronox Lab, Good at Fairchem Organic, Gem Aromatics, and Jayant Agro Org., Average at Valiant Organics, Amal, DMCC Speciality, and the rest, and Below Average at Sudarshan Pharma.<BR><BR>Return Snapshot: The peer with the highest 1-year return is Chembond Chemic. at 50.46%, while the lowest is Amal at -20.22%. DMCC Speciality's 1-year return is -8.92%, which is higher than Amal's but lower than Chembond Chemic.'s. Additionally, peers with a negative six-month return include Gem Aromatics and Chemcon Special.

View full answer

How big is DMCC Speciality?

14-Aug-2026

As of 14th August, DMCC Speciality Chemicals Ltd has a market capitalization of 735.60 Cr, with recent net sales of 707.55 Cr and a net profit of 39.97 Cr.

As of 14th August, DMCC Speciality Chemicals Ltd has a market capitalization of 735.60 Cr, categorizing it as a Micro Cap company.<BR><BR>In the latest four quarters, DMCC Speciality reported Net Sales of 707.55 Cr and a Net Profit of 39.97 Cr.<BR><BR>The latest annual period for the balance sheet is March 2025, with Shareholder's Funds amounting to 227.58 Cr and Total Assets valued at 371.92 Cr.

View full answer

Are DMCC Speciality Chemicals Ltd latest results good or bad?

16-May-2026

DMCC Speciality Chemicals Ltd's latest results show strong revenue growth of 41.86% year-on-year, but profitability concerns arise from a significant decline in operating margin and a low return on equity. While revenue is up, the company faces challenges in managing costs, warranting caution from investors.

The latest results for DMCC Speciality Chemicals Ltd present a mixed picture. On one hand, the company achieved a significant revenue growth of 41.86% year-on-year, reaching ₹177.64 crores in the March 2026 quarter, which is a record for the company. Additionally, net profit increased by 18.24% year-on-year to ₹7.65 crores, reflecting an improvement in profitability.<BR><BR>However, there are notable concerns regarding profitability metrics. The operating margin has contracted sharply from 12.08% in the same quarter last year to 9.96%, indicating rising costs and potential pricing pressures. This margin compression raises questions about the sustainability of the revenue growth, as it suggests that the company is facing challenges in managing its costs effectively.<BR><BR>Furthermore, the interest coverage ratio has deteriorated to 5.25 times, the lowest in recent quarters, which could impact the company's financial flexibility. The return on equity (ROE) stands at a relatively low 8.81%, indicating that the company is not generating strong returns on shareholder capital compared to its peers.<BR><BR>Overall, while DMCC has demonstrated strong revenue growth, the significant margin compression and weak return ratios suggest that the results are not entirely positive. Investors may need to be cautious and monitor how the company addresses these profitability challenges moving forward.

View full answer

When is the next results date for DMCC Speciality Chemicals Ltd?

08-May-2026

The next results date for DMCC Speciality Chemicals Ltd is 15 May 2026.

The next results date for DMCC Speciality Chemicals Ltd is scheduled for 15 May 2026.

View full answer

Is DMCC Speciality technically bullish or bearish?

05-Dec-2025

As of December 4, 2025, DMCC Speciality is in a bearish trend with strong indications of weakness, supported by bearish MACD readings, moving averages, and KST across multiple time frames.

As of 4 December 2025, the technical trend has changed from mildly bearish to bearish. The current stance is bearish with a strong indication of weakness. The weekly and monthly MACD readings are both bearish, reinforcing the negative outlook. The daily moving averages also confirm a bearish trend. Additionally, the KST is bearish on both weekly and monthly time frames, while the Bollinger Bands and OBV show mildly bearish conditions on the weekly. Overall, the combination of these indicators suggests a significant bearish sentiment for DMCC Speciality.

View full answer

How has been the historical performance of DMCC Speciality?

04-Dec-2025

DMCC Speciality's historical performance shows significant growth in net sales and profitability, with net sales rising from INR 327.95 crore in March 2024 to INR 431.30 crore in March 2025, and profit after tax increasing to INR 21.53 crore. However, rising raw material costs impacted overall expenditure, while total assets and liabilities remained stable.

Answer:<BR>The historical performance of DMCC Speciality shows a mixed trend across various financial metrics over the years.<BR><BR>Breakdown:<BR>DMCC Speciality's net sales increased significantly from INR 327.95 crore in March 2024 to INR 431.30 crore in March 2025, following a dip to INR 386.65 crore in March 2023. The total operating income mirrored this trend, reaching INR 431.30 crore in March 2025. However, raw material costs also rose to INR 259.09 crore in March 2025, up from INR 195.51 crore in March 2024, contributing to a total expenditure of INR 374.28 crore. This resulted in an operating profit (PBDIT) of INR 58.36 crore for March 2025, an increase from INR 46.71 crore in the previous year. Profit before tax also improved to INR 31.14 crore in March 2025, compared to INR 17.25 crore in March 2024, leading to a profit after tax of INR 21.53 crore. The company's earnings per share rose to INR 8.63 in March 2025 from INR 4.65 in March 2024. On the balance sheet, total assets increased to INR 371.92 crore in March 2025, while total liabilities were INR 371.92 crore, indicating a stable financial position. Cash flow from operating activities remained steady at INR 38 crore in March 2025, with a net cash inflow of INR 1 crore. Overall, DMCC Speciality demonstrated growth in sales and profitability, despite rising costs and fluctuating cash flows.

View full answer

Is DMCC Speciality overvalued or undervalued?

20-Nov-2025

As of November 19, 2025, DMCC Speciality is considered very attractive and undervalued compared to peers in the specialty chemicals sector, with favorable key ratios indicating strong growth potential despite a recent year-to-date return of -27.89%.

As of 19 November 2025, the valuation grade for DMCC Speciality has moved from attractive to very attractive, indicating a significant improvement in its perceived value. The company is currently considered undervalued, especially when compared to its peers in the specialty chemicals sector. Key ratios include a PE ratio of 23.89, an EV to EBITDA of 11.02, and a PEG ratio of 0.22, which suggests strong growth potential relative to its price.<BR><BR>In comparison with peers, DMCC Speciality's valuation stands out favorably against companies like Solar Industries, which has a PE ratio of 94.38, and Gujarat Fluoroch, with a PE ratio of 56.8, both categorized as very expensive. This stark contrast highlights DMCC's relative attractiveness in the market. Despite recent underperformance with a year-to-date return of -27.89% compared to the Sensex's 9.02%, the fundamental metrics suggest that DMCC Speciality is positioned well for future growth and recovery.

View full answer

Who are the top shareholders of the DMCC Speciality?

17-Jul-2025

The top shareholder of DMCC Speciality is Laxmikumar Narottam Goculdas, holding 36.27%, followed by individual investors with 33.75%. Other notable shareholders include Girish Gulati (HUF) at 2.28%, with minimal holdings from mutual funds (0.01%) and foreign institutional investors (1.16%).

The top shareholders of DMCC Speciality include Laxmikumar Narottam Goculdas, who holds the largest share at 36.27%. The company is primarily owned by promoters, with no pledged promoter holdings reported. Additionally, there are individual investors who collectively hold 33.75% of the shares. The highest public shareholder is Girish Gulati (HUF), with a holding of 2.28%. The company also has a small percentage of shares held by mutual funds (0.01%) and foreign institutional investors (1.16%) across six different entities.

View full answer

Has DMCC Speciality declared dividend?

06-Jun-2025

Yes, DMCC Speciality Chemicals Ltd has declared a 10% dividend, amounting to 1 per share, with an ex-date of August 28, 2024. While the company shows significant volatility in total returns over shorter periods, it has achieved a total return of 235.49% over the past five years.

DMCC Speciality Chemicals Ltd has declared a 10% dividend.<BR><BR>Dividend Details:<BR>- Percentage announced: 10%<BR>- Amount per share: 1<BR>- Ex-date: 28 Aug 24<BR><BR>Dividend Yield: 0.37%.<BR><BR>Total Returns by Period:<BR>Over the last 6 months, the price return was -29.58%, with a dividend return of 0%, resulting in a total return of -29.58%.<BR><BR>In the past year, the price return was -13.21%, the dividend return was 0.31%, leading to a total return of -12.9%.<BR><BR>Over two years, the price return was 4.57%, with a dividend return of 0.37%, resulting in a total return of 4.94%.<BR><BR>For the three-year period, the price return was -26.25%, the dividend return was 0.62%, culminating in a total return of -25.63%.<BR><BR>In the four-year timeframe, the price return was -18.72%, with a dividend return of 0.77%, leading to a total return of -17.95%.<BR><BR>Finally, over five years, the price return was 230.67%, the dividend return was 4.82%, resulting in a total return of 235.49%.<BR><BR>Overall, while DMCC Speciality has declared a dividend, the total returns over various periods show significant volatility, with a notable decline in returns over shorter periods, contrasting with strong returns over the longer five-year horizon.

View full answer
iScoreScore
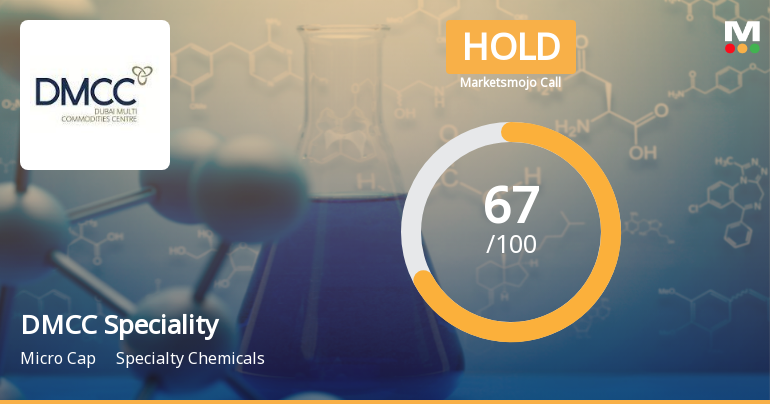
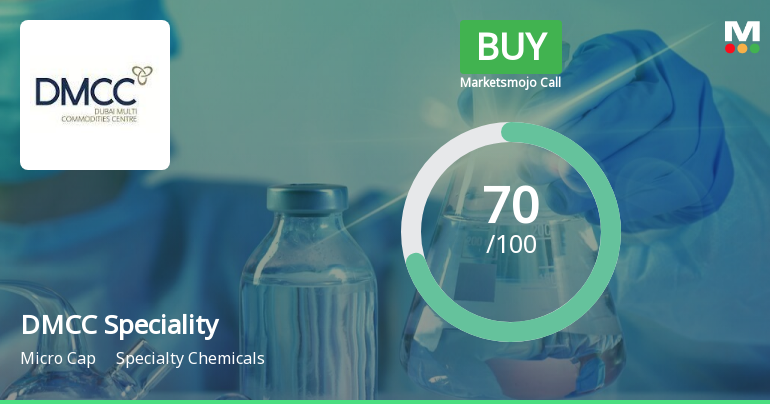
Click here to find our call on this stock
Strong Sell
Sell
Hold
Buy
Strong Buy

Dashboard

1

Poor long term growth as Operating profit has grown by an annual rate 15.49% of over the last 5 years

 
2

With a growth in Net Profit of 162.89%, the company declared Very Positive results in Jun 26

3

With ROCE of 14.4, it has a Fair valuation with a 2.5 Enterprise value to Capital Employed

4

Despite the size of the company, domestic mutual funds hold only 0.02% of the company

5

Below par performance in long term as well as near term

stock-summaryMojo Parameters

Mojo Parameters

Loading Valuation Snapshot...

Stock DNA

stock-summary
Industry

Specialty Chemicals

stock-summary
Market cap

INR 718 Cr (Micro Cap)

stock-summary
P/E

18.00

stock-summary
Industry P/E

43

stock-summary
Dividend Yield

0.85%

stock-summary
Debt Equity

0.33

stock-summary
Return on Equity

11.01%

stock-summary
Price to Book

2.95

Revenue and Profits:
Net Sales:
253 Cr
(Quarterly Results - Jun 2026)
Net Profit:
20 Cr
stock-summaryTotal Returns
Total Returns (Price + Dividend) stock-summary
Dividend Yield (0.85%)
TimePeriod
Price Return
Dividend Return
Total Return
3 Months
1.66%
0.90%
2.56%
6 Months
17.74%
1.07%
18.81%
1 Year
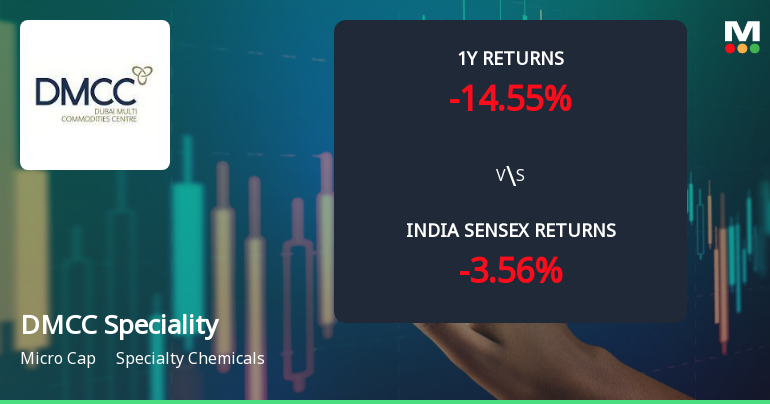
-16.34%
0.74%
-15.6%
2 Years
2.69%
1.76%
4.45%
3 Years
-6.77%
1.71%
-5.06%
4 Years
-23.51%
1.55%
-21.96%
5 Years
-12.03%
2.08%
-9.95%

Latest dividend: 2.5 per share ex-dividend date: Aug-22-2025

Risk Adjusted Returns v/s stock-summary
Returns Beta
Icon
Beta has not been calculated since enough price history is not available
stock-summaryNews & Corporate Actions

Announcements stock-summary

Submission Of Notice Of The 105Th Annual General Meeting (AGM) For The Financial Year 2025-26.

18-Aug-2026 | Source : BSE

As per attachment.

Reg. 34 (1) Annual Report.

18-Aug-2026 | Source : BSE

Submission of Annual Report and Notice of the 105th Annual General Meeting (AGM) for the Financial Year 2025-26.

Announcement under Regulation 30 (LODR)-Press Release / Media Release

13-Aug-2026 | Source : BSE

Press Release on financial performance for Q1 FY27

Corporate Actions stock-summary

stock-summary
BOARD MEETING

No Upcoming Board Meetings

stock-summary
DIVIDEND

DMCC Speciality Chemicals Ltd has declared 25% dividend, ex-date: 21 Aug 26

stock-summary
SPLITS

No Splits history available

stock-summary
BONUS

No Bonus history available

stock-summary
RIGHTS

No Rights history available

stock-summaryKey Factors

Quality key factors stock-summary

Factor
Value
Sales Growth (5y)
25.02%
EBIT Growth (5y)
15.49%
EBIT to Interest (avg)
3.79
Debt to EBITDA (avg)
1.64
Net Debt to Equity (avg)
0.33
Sales to Capital Employed (avg)
1.38
Tax Ratio
27.51%
Dividend Payout Ratio
28.96%
Pledged Shares
0
Institutional Holding
1.65%
ROCE (avg)
11.04%
ROE (avg)
8.10%

Valuation key factors

Factor
Value
P/E Ratio
18
Industry P/E
43
Price to Book Value
2.95
EV to EBIT
12.48
EV to EBITDA
10.11
EV to Capital Employed
2.46
EV to Sales
1.15
PEG Ratio
0.42
Dividend Yield
0.85%
ROCE (Latest)
14.39%
ROE (Latest)
11.01%

Technicals key factors

Indicator
Weekly
Monthly
MACD
Bullish
Mildly Bullish
RSI
No Signal
Bearish
Bollinger Bands
Mildly Bullish
Bullish
Moving Averages
Bullish (Daily)
KST
Mildly Bearish
Bearish
Dow Theory
No Trend
Mildly Bullish
OBV
No Trend
Bullish
stock-summary Technical Indicator Scale: Bearish, Mildly Bearish, Sideways, Mildly Bullish, Bullish  Turned 
stock-summaryShareholding
Shareholding Snapshot : Jun 2026stock-summary
Shareholding Compare (%holding) stock-summary
Majority shareholders

Promoters

Pledged Promoter Holdings

None

Mutual Funds

Held by 1 Schemes (0.01%)

FIIs

Held by 2 FIIs (0.15%)

Promoter with highest holding

Laxmikumar Narottam Goculdas (36.27%)

Highest Public shareholder

Girish Gulati (huf) . (2.28%)

Individual Investors Holdings

32.85%

stock-summaryFinancial
[
  {
    "link": "quarterly",
    "btn_text": "All Quarterly Results",
    "header": "Quarterly Results Snapshot (Consolidated) - Jun'26 - YoY",
    "rhs": [
      {
        "prefix": "Net Sales ",
        "suffix": "YoY Growth in quarter ended Jun 2026 is 99.16% vs 48.90% in Jun 2025",
        "dir": 1
      },
      {
        "prefix": "Consolidated Net Profit ",
        "suffix": "YoY Growth in quarter ended Jun 2026 is 162.89% vs 466.42% in Jun 2025",
        "dir": -1
      }
    ],
    "table": {
      "header": [
        "Jun'26",
        "Jun'25",
        "Change(%)"
      ],
      "body": [
        {
          "field": "Net Sales",
          "val1": "253.01",
          "val2": "127.04",
          "chgp": "99.16%",
          "chgp_class": "positive"
        },
        {
          "field": "Operating Profit (PBDIT) excl Other Income",
          "val1": "34.13",
          "val2": "16.88",
          "chgp": "102.19%",
          "chgp_class": "positive"
        },
        {
          "field": "Interest",
          "val1": "3.49",
          "val2": "2.03",
          "chgp": "71.92%",
          "chgp_class": "negative"
        },
        {
          "field": "Exceptional Items",
          "val1": "0.00",
          "val2": "0.00",
          "chgp": "",
          "chgp_class": "neutral"
        },
        {
          "field": "Consolidate Net Profit",
          "val1": "20.40",
          "val2": "7.76",
          "chgp": "162.89%",
          "chgp_class": "positive"
        },
        {
          "field": "Operating Profit Margin (Excl OI)",
          "val1": "13.49%",
          "val2": "13.29%",
          "chgp": "0.20%",
          "chgp_class": "positive"
        }
      ]
    }
  },
  {
    "link": "half-yearly",
    "btn_text": "All Half Yearly Results",
    "header": "Half Yearly Results Snapshot (Consolidated) - Sep'25",
    "rhs": [
      {
        "prefix": "Net Sales ",
        "suffix": " Growth in half year ended Sep 2025 is 34.58% vs 16.00% in Sep 2024",
        "dir": 1
      },
      {
        "prefix": "Consolidated Net Profit ",
        "suffix": " Growth in half year ended Sep 2025 is 88.16% vs 30.31% in Sep 2024",
        "dir": 1
      }
    ],
    "table": {
      "header": [
        "Sep'25",
        "Sep'24",
        "Change(%)"
      ],
      "body": [
        {
          "field": "Net Sales",
          "val1": "253.07",
          "val2": "188.04",
          "chgp": "34.58%",
          "chgp_class": "positive"
        },
        {
          "field": "Operating Profit (PBDIT) excl Other Income",
          "val1": "30.87",
          "val2": "24.16",
          "chgp": "27.77%",
          "chgp_class": "positive"
        },
        {
          "field": "Interest",
          "val1": "3.93",
          "val2": "5.78",
          "chgp": "-32.01%",
          "chgp_class": "positive"
        },
        {
          "field": "Exceptional Items",
          "val1": "0.00",
          "val2": "0.00",
          "chgp": "",
          "chgp_class": "neutral"
        },
        {
          "field": "Consolidate Net Profit",
          "val1": "13.51",
          "val2": "7.18",
          "chgp": "88.16%",
          "chgp_class": "positive"
        },
        {
          "field": "Operating Profit Margin (Excl OI)",
          "val1": "12.20%",
          "val2": "12.85%",
          "chgp": "-0.65%",
          "chgp_class": "negative"
        }
      ]
    }
  },
  {
    "link": "nine-monthly",
    "btn_text": "All Nine Monthly Results",
    "header": "Nine Monthly Results Snapshot (Consolidated) - Dec'25",
    "rhs": [
      {
        "prefix": "Net Sales ",
        "suffix": "YoY Growth in nine months ended Dec 2025 is 31.97% vs 26.15% in Dec 2024",
        "dir": 1
      },
      {
        "prefix": "Consolidated Net Profit ",
        "suffix": "YoY Growth in nine months ended Dec 2025 is 30.76% vs 158.59% in Dec 2024",
        "dir": -1
      }
    ],
    "table": {
      "header": [
        "Dec'25",
        "Dec'24",
        "Change(%)"
      ],
      "body": [
        {
          "field": "Net Sales",
          "val1": "403.94",
          "val2": "306.08",
          "chgp": "31.97%",
          "chgp_class": "positive"
        },
        {
          "field": "Operating Profit (PBDIT) excl Other Income",
          "val1": "45.59",
          "val2": "41.89",
          "chgp": "8.83%",
          "chgp_class": "positive"
        },
        {
          "field": "Interest",
          "val1": "6.24",
          "val2": "8.31",
          "chgp": "-24.91%",
          "chgp_class": "positive"
        },
        {
          "field": "Exceptional Items",
          "val1": "0.00",
          "val2": "0.00",
          "chgp": "",
          "chgp_class": "neutral"
        },
        {
          "field": "Consolidate Net Profit",
          "val1": "19.68",
          "val2": "15.05",
          "chgp": "30.76%",
          "chgp_class": "positive"
        },
        {
          "field": "Operating Profit Margin (Excl OI)",
          "val1": "11.29%",
          "val2": "13.69%",
          "chgp": "-2.40%",
          "chgp_class": "negative"
        }
      ]
    }
  },
  {
    "link": "annual",
    "btn_text": "All Annual Results",
    "header": "Annual Results Snapshot (Consolidated) - Mar'26",
    "rhs": [
      {
        "prefix": "Net Sales ",
        "suffix": "YoY Growth in year ended Mar 2026 is 34.84% vs 31.51% in Mar 2025",
        "dir": 1
      },
      {
        "prefix": "Consolidated Net Profit ",
        "suffix": "YoY Growth in year ended Mar 2026 is 26.94% vs 85.76% in Mar 2025",
        "dir": -1
      }
    ],
    "table": {
      "header": [
        "Mar'26",
        "Mar'25",
        "Change(%)"
      ],
      "body": [
        {
          "field": "Net Sales",
          "val1": "581.58",
          "val2": "431.30",
          "chgp": "34.84%",
          "chgp_class": "positive"
        },
        {
          "field": "Operating Profit (PBDIT) excl Other Income",
          "val1": "63.30",
          "val2": "57.02",
          "chgp": "11.01%",
          "chgp_class": "positive"
        },
        {
          "field": "Interest",
          "val1": "9.61",
          "val2": "10.50",
          "chgp": "-8.48%",
          "chgp_class": "positive"
        },
        {
          "field": "Exceptional Items",
          "val1": "0.00",
          "val2": "0.00",
          "chgp": "",
          "chgp_class": "neutral"
        },
        {
          "field": "Consolidate Net Profit",
          "val1": "27.33",
          "val2": "21.53",
          "chgp": "26.94%",
          "chgp_class": "positive"
        },
        {
          "field": "Operating Profit Margin (Excl OI)",
          "val1": "10.88%",
          "val2": "13.22%",
          "chgp": "-2.34%",
          "chgp_class": "negative"
        }
      ]
    }
  }
]

Quarterly Results Snapshot (Consolidated) - Jun'26 - YoYstock-summary

Jun'26
Jun'25
Change(%)
Net Sales
253.01
127.04
99.16%
Operating Profit (PBDIT) excl Other Income
34.13
16.88
102.19%
Interest
3.49
2.03
71.92%
Exceptional Items
0.00
0.00
Consolidate Net Profit
20.40
7.76
162.89%
Operating Profit Margin (Excl OI)
13.49%
13.29%
0.20%
Values in Rs Cr.
Direction Arrows
Net Sales

YoY Growth in quarter ended Jun 2026 is 99.16% vs 48.90% in Jun 2025

Direction Arrows
Consolidated Net Profit

YoY Growth in quarter ended Jun 2026 is 162.89% vs 466.42% in Jun 2025

Half Yearly Results Snapshot (Consolidated) - Sep'25stock-summary

Sep'25
Sep'24
Change(%)
Net Sales
253.07
188.04
34.58%
Operating Profit (PBDIT) excl Other Income
30.87
24.16
27.77%
Interest
3.93
5.78
-32.01%
Exceptional Items
0.00
0.00
Consolidate Net Profit
13.51
7.18
88.16%
Operating Profit Margin (Excl OI)
12.20%
12.85%
-0.65%
Values in Rs Cr.
Direction Arrows
Net Sales

Growth in half year ended Sep 2025 is 34.58% vs 16.00% in Sep 2024

Direction Arrows
Consolidated Net Profit

Growth in half year ended Sep 2025 is 88.16% vs 30.31% in Sep 2024

Nine Monthly Results Snapshot (Consolidated) - Dec'25stock-summary

Dec'25
Dec'24
Change(%)
Net Sales
403.94
306.08
31.97%
Operating Profit (PBDIT) excl Other Income
45.59
41.89
8.83%
Interest
6.24
8.31
-24.91%
Exceptional Items
0.00
0.00
Consolidate Net Profit
19.68
15.05
30.76%
Operating Profit Margin (Excl OI)
11.29%
13.69%
-2.40%
Values in Rs Cr.
Direction Arrows
Net Sales

YoY Growth in nine months ended Dec 2025 is 31.97% vs 26.15% in Dec 2024

Direction Arrows
Consolidated Net Profit

YoY Growth in nine months ended Dec 2025 is 30.76% vs 158.59% in Dec 2024

Annual Results Snapshot (Consolidated) - Mar'26stock-summary

Mar'26
Mar'25
Change(%)
Net Sales
581.58
431.30
34.84%
Operating Profit (PBDIT) excl Other Income
63.30
57.02
11.01%
Interest
9.61
10.50
-8.48%
Exceptional Items
0.00
0.00
Consolidate Net Profit
27.33
21.53
26.94%
Operating Profit Margin (Excl OI)
10.88%
13.22%
-2.34%
Values in Rs Cr.
Direction Arrows
Net Sales

YoY Growth in year ended Mar 2026 is 34.84% vs 31.51% in Mar 2025

Direction Arrows
Consolidated Net Profit

YoY Growth in year ended Mar 2026 is 26.94% vs 85.76% in Mar 2025

stock-summaryCompany CV
About DMCC Speciality Chemicals Ltd stock-summary
stock-summary
DMCC Speciality Chemicals Ltd
Micro Cap
Specialty Chemicals
DMCC Speciality Chemicals Limited was erstwhile incorporated as 'Dharamsi Morarji Chemicals Company Limited' on September 25, 1919. The Company changed the name from 'Dharamsi Morarji Chemicals Company Limited' to 'DMCC Speciality Chemicals Limited' on August 12, 2022. Promoted by the Late Ratansi D Morarji to manufacture chemicals at Ambernath, Company is a pioneer in the Indian chemical industry.
Company Coordinates stock-summary
Company Details
Prospect Chambers, 317/21 Dr D N Road Fort Mumbai Maharashtra : 400001
stock-summary
Tel: 91-22-22048881/2/3
stock-summary
dgokhale@dmcc.com
Registrar Details
Link Intime India Pvt Ltd, C-13 Pannalal Silk Compound, L B S Marg, Bhandup , Mumbai