
Compare Chemfab Alka. with Similar Stocks
Dashboard
Poor long term growth as Operating profit has grown by an annual rate -182.98% of over the last 5 years
The company has declared Negative results for the last 12 consecutive quarters
Risky - Negative Operating Profits
Despite the size of the company, domestic mutual funds hold only 0.25% of the company
Below par performance in long term as well as near term
Stock DNA
Commodity Chemicals
INR 571 Cr (Micro Cap)
NA (Loss Making)
41
0.31%
0.30
-0.91%
1.49
Total Returns (Price + Dividend) 
Latest dividend: 1.2 per share ex-dividend date: Sep-04-2025
Risk Adjusted Returns v/s
Returns Beta

News

Chemfab Alkalis Ltd Locks at Lower Circuit With 5% Loss — Sellers Queue, No Buyers in Sight
At Rs 384.75, sellers were still queuing — but there were no buyers willing to take the other side. Chemfab Alkalis Ltd locked at its lower circuit of 5% on 11 Jun 2026, with unfilled sell orders and a frozen price, signalling a pronounced imbalance in supply and demand.
Read full news article
Chemfab Alkalis Ltd is Rated Strong Sell
Chemfab Alkalis Ltd is rated Strong Sell by MarketsMOJO. This rating was last updated on 15 May 2026. However, the analysis and financial metrics discussed below reflect the stock’s current position as of 09 June 2026, providing investors with the latest insights into the company’s performance and outlook.
Read full news article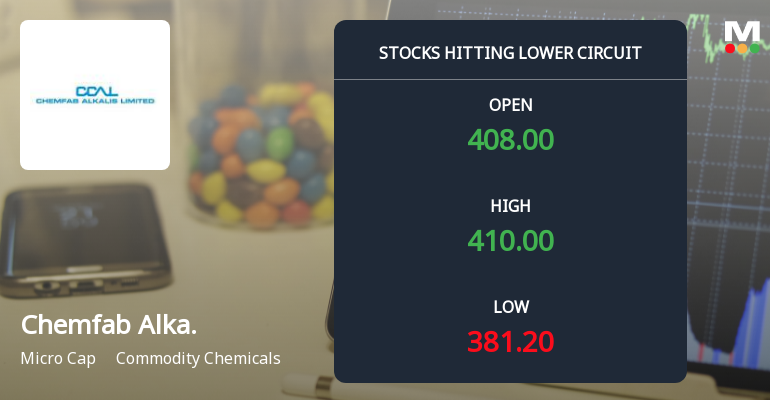
Below All Moving Averages and Now at Lower Circuit: Chemfab Alkalis Ltd Loses 5% in a Single Session
At Rs 381.2, sellers were still queuing — but there were no buyers willing to take the other side. Chemfab Alkalis Ltd locked at its lower circuit of 5% on 29 May 2026, with unfilled sell orders and a frozen price that capped losses for the day.
Read full news article Announcements
Announcement under Regulation 30 (LODR)-Newspaper Publication
06-Jun-2026 | Source : BSESubmission of copy of newspaper publication wrt. SEBI circular dated 30th Jan 2026 on special window for transfer and dematerialisation of physical securities.
Compliances-Reg.24(A)-Annual Secretarial Compliance
26-May-2026 | Source : BSEDear Sir/Mam Please find enclosed Annual Secretarial Compliance Report for the financial Year ended 31st March 2026
Announcement under Regulation 30 (LODR)-Acquisition
20-May-2026 | Source : BSESubmission of Letter dated 20th May 2026 regarding investment by the Company in Zenataris Renewable Energy Private Limited. Kindly take the same on record.
Corporate Actions

No Upcoming Board Meetings

Chemfab Alkalis Ltd has declared 12% dividend, ex-date: 04 Sep 25

No Splits history available

No Bonus history available

No Rights history available
Quality key factors
Valuation key factors
Technicals key factors
 Technical Indicator Scale: Bearish, Mildly Bearish, Sideways, Mildly Bullish, Bullish Turned
 Shareholding Snapshot : Mar 2026
Shareholding Compare (%holding)
Promoters
None
Held by 2 Schemes (0.07%)
Held by 2 FIIs (0.04%)
Dr Rao Holdings Pte Ltd (47.04%)
V. M. Srinivasan (1.8%)
21.63%
Quarterly Results Snapshot (Consolidated) - Mar'26 - QoQ

QoQ Growth in quarter ended Mar 2026 is 9.74% vs -11.00% in Dec 2025
QoQ Growth in quarter ended Mar 2026 is 110.79% vs -121.39% in Dec 2025
Half Yearly Results Snapshot (Consolidated) - Sep'25
Growth in half year ended Sep 2025 is 6.10% vs -0.14% in Sep 2024
Growth in half year ended Sep 2025 is 50.00% vs -97.39% in Sep 2024
Nine Monthly Results Snapshot (Consolidated) - Dec'25

YoY Growth in nine months ended Dec 2025 is -2.40% vs -1.20% in Dec 2024
YoY Growth in nine months ended Dec 2025 is -274.55% vs -89.29% in Dec 2024
Annual Results Snapshot (Consolidated) - Mar'26
YoY Growth in year ended Mar 2026 is -6.98% vs 2.16% in Mar 2025
YoY Growth in year ended Mar 2026 is 50.58% vs -126.37% in Mar 2025
About Chemfab Alkalis Ltd

Company Coordinates


