
Compare Chemtech Indust. with Similar Stocks
Dashboard
Poor long term growth as Operating profit has grown by an annual rate 9.14% of over the last 5 years
The company has declared Negative results for the last 3 consecutive quarters
With ROE of 4.7, it has a Very Expensive valuation with a 1.3 Price to Book Value
Underperformed the market in the last 1 year
Stock DNA
Industrial Manufacturing
INR 136 Cr (Micro Cap)
27.00
21
0.00%
-0.56
4.66%
1.25
Total Returns (Price + Dividend) 
Chemtech Indust. for the last several years.
Risk Adjusted Returns v/s
Returns Beta

News
Are Chemtech Industrial Valves Ltd latest results good or bad?
Chemtech Industrial Valves Ltd's latest financial results for Q4 FY26 reveal significant operational challenges. The company reported net sales of ₹10.07 crores, reflecting a year-on-year decline of 18.53% from ₹12.36 crores in Q4 FY25. This downturn in revenue is particularly concerning as it follows a notable sequential increase of 85.11% from ₹5.44 crores in Q3 FY26, indicating high volatility in order execution. The net profit for the quarter was ₹0.60 crores, which represents a substantial decline of 66.29% compared to ₹1.78 crores in the same quarter last year. The operating margin, excluding other income, turned negative at -0.20%, a stark contrast to the positive margin of 11.33% reported in Q4 FY25. This indicates a complete erosion of operating profitability, raising alarms about the company's core operational effectiveness. Moreover, the company's reliance on non-operating income has become exc...
Read full news article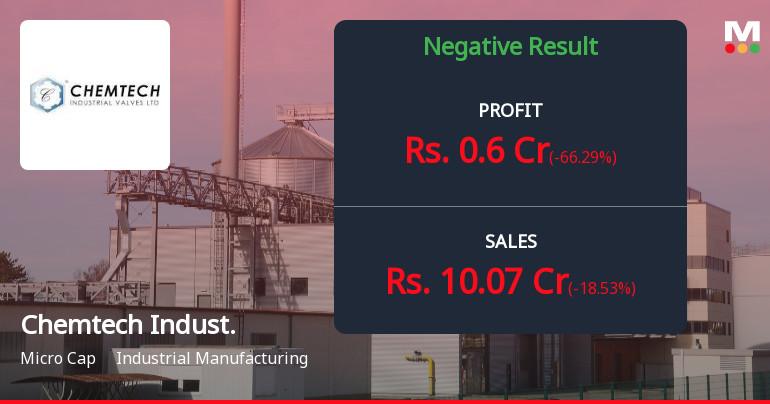
Chemtech Industrial Valves Q4 FY26: Profitability Collapses as Revenue Slumps
Chemtech Industrial Valves Ltd., a micro-cap industrial valve manufacturer, reported deeply disappointing Q4 FY26 results, with net profit plunging to ₹0.60 crores from ₹1.78 crores in Q4 FY25—a sharp 66.29% year-on-year decline. The quarter-on-quarter comparison showed marginal improvement from ₹0.19 crores in Q3 FY26, representing a 215.79% sequential rise, but this recovery proved insufficient to offset the broader deterioration in operational performance.
Read full news article
Chemtech Industrial Valves Ltd is Rated Strong Sell
Chemtech Industrial Valves Ltd is rated Strong Sell by MarketsMOJO. This rating was last updated on 15 Nov 2025, reflecting a reassessment of the stock’s outlook. However, all fundamentals, returns, and financial metrics discussed below are based on the company’s current position as of 01 June 2026, providing investors with the latest comprehensive analysis.
Read full news article Announcements
Intimation Under Regulation 30 Of The SEBI (LODR) Regulations 2015 For Re-Appointment Of Internal Audit Of The Company
01-Jun-2026 | Source : BSEPursunant to Regulation 30 of SEBI LODR Regulations 2015 this is to inform you that on the basis of recommendation of NRC and Audit committee the Board approved the re-appointment of Mr. Vikas More as Internal Auditor.
Announcement under Regulation 30 (LODR)-Newspaper Publication
01-Jun-2026 | Source : BSEPursuant to Regulation 47 of SEBI LODR Regulations 2015 please find enclosed Newspaper clippings of published financial results for the Quarter and Financial Year ended March 31 2026.
Board Meeting Outcome for Outcome Of The Board Meeting Held On Saturday May 30 2026.
30-May-2026 | Source : BSEPursuant to Regulation 30 and other applicable provisions of the SEBI (Listing Obligations and Disclosure Requirements) Regulations 2015 (SEBI LODR Regulations 2015) and our letter dated May 19 2026 this is to inform you that the Board of Directors of the Company at its Meeting held on Saturday May 30 2026 has inter-alia considered and approved Audited Financial Results of the Company for the Quarter and Financial Year ended March 31 2026 and took note of the Audit Report thereon submitted by Statutory Auditor of the Company M/s. Raju & Prasad Chartered Accountants in terms of Regulation 33 of SEBI LODR Regulations 2015.
Corporate Actions

No Upcoming Board Meetings

No Dividend history available

No Splits history available

No Bonus history available

No Rights history available
Quality key factors
Valuation key factors
Technicals key factors
 Technical Indicator Scale: Bearish, Mildly Bearish, Sideways, Mildly Bullish, Bullish Turned
 Shareholding Snapshot : Mar 2026
Shareholding Compare (%holding)
Non Institution
None
Held by 1 Schemes (1.33%)
Held by 0 FIIs
Harsh Pradeep Badkur (12.47%)
Vikas Vijaykumar Khemani (8.36%)
48.36%
Quarterly Results Snapshot (Standalone) - Mar'26 - YoY

YoY Growth in quarter ended Mar 2026 is -18.53% vs 18.85% in Mar 2025
YoY Growth in quarter ended Mar 2026 is -66.29% vs 54.78% in Mar 2025
Half Yearly Results Snapshot (Standalone) - Sep'25
Growth in half year ended Sep 2025 is -24.55% vs 90.49% in Sep 2024
Growth in half year ended Sep 2025 is 13.10% vs 94.79% in Sep 2024
Nine Monthly Results Snapshot (Standalone) - Dec'25
YoY Growth in nine months ended Dec 2025 is -27.36% vs 31.95% in Dec 2024
YoY Growth in nine months ended Dec 2025 is -15.65% vs 74.09% in Dec 2024
Annual Results Snapshot (Standalone) - Mar'26
YoY Growth in year ended Mar 2026 is -24.65% vs 27.60% in Mar 2025
YoY Growth in year ended Mar 2026 is -28.49% vs 69.16% in Mar 2025
About Chemtech Industrial Valves Ltd

Company Coordinates


