CIE Automotive

  • Market Cap: Small Cap
  • Industry: Auto Components & Equipments
  • ISIN: INE536H01010
  • NSEID: CIEINDIA
  • BSEID: 532756
INR
412.40
4.05 (0.99%)
BSENSE

Jul 29, 11:56 AM

BSE+NSE Vol: 1.16 lacs

  • Price Points
  • Score
  • Mojo Parameters
  • Total Return
  • News and Corporate Actions
  • Key factors
  • Shareholding
  • Financials
  • CompanyCV
stock-summaryPrice Point
High/Low

1Day

52 Week

Valuation
Technical
Day's Volume

CASH

1.16 lacs (-82.43%) Volume

Shareholding (Jun 2026)

FII

4.95%

Held by 159 FIIs

DII

20.70%

Held by 31 DIIs

Promoter

65.70%

Why is CIE Automotive India Ltd falling/rising?

28-Jul-2026

As of 28-Jul, CIE Automotive India Ltd's stock price is declining at 408.35, down 1.17%, with a total drop of 13.85% over the past week. Despite a low debt-to-equity ratio and a profit increase of 14.5% over the past year, the stock is underperforming and trading below all moving averages, reflecting negative market sentiment.

As of 28-Jul, CIE Automotive India Ltd is experiencing a decline in its stock price, currently at 408.35, which reflects a change of -4.85 (-1.17%). The stock has been underperforming significantly, with a consecutive fall over the last seven days, resulting in a total decline of -13.85% during this period. This trend is further illustrated by the stock's performance over various time frames, showing a -13.54% drop over the past week and a -13.34% decrease over the past month, while the benchmark Sensex has only fallen by -0.91% and -0.43%, respectively.<BR><BR>Additionally, CIE Automotive is trading below its moving averages across all time frames, including the 5-day, 20-day, 50-day, 100-day, and 200-day averages, indicating a bearish trend. The stock's liquidity has also been affected, with a significant drop in delivery volume by -65.58% compared to the 5-day average, suggesting reduced investor interest.<BR><BR>Despite these negative factors, the company maintains a low debt-to-equity ratio of 0.05 and has shown a profit increase of 14.5% over the past year, which indicates some underlying strength. However, the current market sentiment is clearly negative, leading to the stock's decline.

View full answer

Should I buy, sell or hold CIE Automotive India Ltd?

24-Jul-2026

Are CIE Automotive India Ltd latest results good or bad?

23-Jul-2026

CIE Automotive India Ltd's latest results show a year-on-year net profit growth of 15.77% and record quarterly revenue, but sequentially, net profit declined by 5.51% and operating margins decreased, leading to a 9.29% drop in stock price, indicating mixed performance and investor concerns.

CIE Automotive India Ltd's latest results present a mixed picture. On one hand, the company achieved a year-on-year net profit growth of 15.77%, reaching ₹235.62 crores, and net sales increased by 10.62% compared to the same quarter last year, marking the highest quarterly revenue in its history at ₹2,620.55 crores. This indicates healthy demand for its auto components portfolio.<BR><BR>However, the results also show some concerning trends. Sequentially, the net profit declined by 5.51%, and the operating margin decreased to 14.87%, down 52 basis points from the previous quarter. This margin compression, coupled with only a modest 0.33% growth in net sales compared to the prior quarter, suggests that the company is facing operational pressures, particularly from rising employee costs.<BR><BR>The market reacted negatively to these results, with the stock price dropping 9.29% following the announcement, indicating investor disappointment. Overall, while there are positive year-on-year growth indicators, the sequential declines in profit and margins raise concerns about the company's near-term performance.

View full answer

How big is CIE Automotive?

11-Jun-2026

As of 10th June, CIE Automotive India Ltd has a market capitalization of 16,618.00 Cr, with recent net sales of 9,745.79 Cr and net profit of 871.15 Cr over the last four quarters.

As of 10th June, <BR><BR>Market Cap: CIE Automotive India Ltd has a market capitalization of 16,618.00 Cr, categorizing it as a Small Cap company.<BR><BR>Recent Quarterly Performance: The sum of Net Sales for the latest 4 quarters is 9,745.79 Cr, while the sum of Net Profit for the same period is 871.15 Cr.<BR><BR>Balance Sheet Snapshot: The reporting period for the latest annual data is December 2025. Shareholder's Funds stand at 7,459.14 Cr, and Total Assets are valued at 10,735.51 Cr.

View full answer

Who are in the management team of CIE Automotive?

11-Jun-2026

The management team of CIE Automotive includes key members such as Chairman Shriprakash Shukla, Executive Directors Ander Arenaza Alvare and Manoj Mullassery Menon, and several independent directors, including Suhail A Nathani and Alan Savio D'Silva Picardo, among others. This diverse team oversees the company's governance and operations.

The management team of CIE Automotive includes the following key members:<BR><BR>1. **Suhail A Nathani** - Independent Director<BR>2. **Jesus Maria Herrera Barandiaran** - Director<BR>3. **Manoj Maheshwari** - Independent Director<BR>4. **Shriprakash Shukla** - Chairman (Non-Executive)<BR>5. **Ander Arenaza Alvare** - Executive Director<BR>6. **Pankaj Goyal** - Company Secretary & Compliance Officer<BR>7. **Alan Savio D'Silva Picardo** - Independent Director<BR>8. **Roxana Meda Inoriza** - Independent Director<BR>9. **Manoj Mullassery Menon** - Executive Director<BR>10. **Kadambi Narahari** - Independent Director<BR>11. **Dhananjay N Mungale** - Independent Director<BR><BR>This team comprises a mix of independent directors and executive roles, contributing to the governance and operational management of the company.

View full answer

Who are the peers of the CIE Automotive?

11-Jun-2026

CIE Automotive's peers include Craftsman Auto, HBL Engineering, Belrise Industri, Sansera Engineering, Sundram Fasteners, JBM Auto, Minda Corp, Shriram Pistons, Amara Raja Energy, and Gabriel India. In terms of management risk, growth, and capital structure, CIE Automotive ranks well but has a 1-year return of -8.44%, better than Amara Raja Energy but lower than its other peers.

Peers: The peers of CIE Automotive are Craftsman Auto, HBL Engineering, Belrise Industri, Sansera Enginee., Sundram Fasten., JBM Auto, Minda Corp, Shriram Pistons, Amara Raja Ener., and Gabriel India.<BR><BR>Quality Snapshot: Excellent management risk is observed at Shriram Pistons, while Good management risk is found at Craftsman Auto, Sansera Enginee., Sundram Fasten., Minda Corp, and Amara Raja Ener. Average management risk is present at HBL Engineering and JBM Auto, and the rest have Average management risk. For Growth, Excellent growth is noted at Craftsman Auto, HBL Engineering, JBM Auto, Minda Corp, and Shriram Pistons, while Good growth is found at CIE Automotive, and the rest have Below Average or Average growth. In terms of Capital Structure, Excellent capital structure is seen at HBL Engineering, Sundram Fasten., Shriram Pistons, and Amara Raja Ener., while Good capital structure is present at Craftsman Auto, Sansera Enginee., Minda Corp, and CIE Automotive, and the rest have Average capital structure.<BR><BR>Return Snapshot: The peer with the highest 1-year return is Belrise Industri at 110.46%, while the lowest is Amara Raja Ener. at -20.83%. CIE Automotive's 1-year return is -8.44%, which is higher than Amara Raja Ener. but lower than all other peers. Additionally, Sundram Fasten. and Amara Raja Ener. have negative six-month returns.

View full answer

What does CIE Automotive do?

10-Jun-2026

CIE Automotive India Ltd operates in the auto components industry, originally founded as Mahindra Automotive Steels in 1999. As of March 2026, it reported net sales of ₹2,612 Cr and a net profit of ₹249 Cr, with a market cap of ₹16,618 Cr.

Overview:<BR>CIE Automotive India Ltd operates in the auto components and equipment industry and is classified as a small-cap company.<BR><BR>History:<BR>CIE Automotive India Limited was originally incorporated as a public company under the name 'Mahindra Automotive Steels Limited' in 1999. It was converted into a private limited company on January 15, 2003, and subsequently renamed Mahindra Automotive Steels Private Limited. The most recent quarterly results reported net sales and net profit for the period ending March 2026.<BR><BR>Financial Snapshot:<BR>- Net Sales: 2,612 Cr (Quarterly Results - Mar 2026)<BR>- Net Profit: 249 Cr (Quarterly Results - Mar 2026)<BR>- Market Cap: INR 16,618 Cr (Small Cap)<BR><BR>Key Metrics:<BR>- P/E: 19.00<BR>- Industry P/E: 46<BR>- Dividend Yield: 1.59%<BR>- Debt Equity: -0.17<BR>- Return on Equity: 11.05%<BR>- Price to Book: 2.24<BR><BR>Contact Details:<BR>Address: Suite F9D Grand Hyatt Plaza, Santacruz (E) Mumbai Maharashtra : 400055<BR>Tel: 91-022-62411031<BR>Email: mcie.investors@mahindra.com<BR>Website: http://www.mahindracie.com

View full answer

When is the next results date for CIE Automotive India Ltd?

04-Feb-2026

The next results date for CIE Automotive India Ltd is 19 February 2026.

The next results date for CIE Automotive India Ltd is scheduled for 19 February 2026.

View full answer

Is CIE Automotive technically bullish or bearish?

02-Dec-2025

As of December 1, 2025, CIE Automotive's trend is mildly bullish, supported by daily moving averages and weekly MACD, though caution is advised due to mixed monthly indicators showing bearish signals.

As of 1 December 2025, the technical trend for CIE Automotive has changed from sideways to mildly bullish. The current stance is mildly bullish, primarily driven by the daily moving averages indicating a bullish trend. The weekly MACD also supports this mildly bullish outlook, while the monthly indicators present a mixed picture with the MACD and KST showing bearish signals. The Bollinger Bands on the weekly chart are sideways, suggesting a lack of volatility in that time frame. Overall, the strength of the bullish signal is moderate, with some caution warranted due to the bearish monthly indicators.

View full answer

How has been the historical performance of CIE Automotive?

16-Oct-2025

CIE Automotive's historical performance shows fluctuating net sales, decreasing from 9,280.35 Cr in December 2023 to 8,964.07 Cr in December 2024, while consolidated net profit fell to 827.51 Cr. Despite a slight decline in operating profit and earnings per share, profit before tax increased marginally, indicating mixed financial results over the years.

Answer:<BR>The historical performance of CIE Automotive shows a fluctuating trend in net sales, with values reaching 8,964.07 Cr in December 2024, down from 9,280.35 Cr in December 2023, but up from 8,753.04 Cr in December 2022. The total operating income followed a similar pattern, with a slight decrease to 8,964.07 Cr in December 2024 from 9,280.35 Cr in the previous year. Operating profit (PBDIT) was 1,490.23 Cr in December 2024, slightly down from 1,505.90 Cr in December 2023, yet significantly higher than the 1,230.30 Cr recorded in December 2022. Profit before tax showed a marginal increase to 1,081.97 Cr in December 2024 from 1,076.34 Cr in December 2023, while profit after tax rose to 817.61 Cr from 798.12 Cr in the same period. The consolidated net profit, however, decreased to 827.51 Cr in December 2024 from 1,125.15 Cr in December 2023. <BR><BR>In terms of balance sheet metrics, total assets for December 2024 were reported at 9,748.75 Cr, slightly down from 9,752.58 Cr in December 2023. Total liabilities remained relatively stable at 9,748.75 Cr in December 2024 compared to 9,752.58 Cr the previous year. The company’s cash flow from operating activities decreased to 880.00 Cr in December 2024 from 1,383.00 Cr in December 2023, while net cash inflow improved to 91.00 Cr from 51.00 Cr. The earnings per share (EPS) fell to 21.81 in December 2024 from 29.66 in December 2023, indicating a decline in profitability per share. Overall, CIE Automotive has experienced a mix of growth and decline across various financial metrics over the past few years, reflecting a complex operational landscape. <BR><BR>Breakdown:<BR>CIE Automotive's net sales peaked at 9,280.35 Cr in December 2023 but fell to 8,964.07 Cr in December 2024, while total operating income mirrored this decline. Operating profit (PBDIT) decreased slightly to 1,490.23 Cr in December 2024 from 1,505.90 Cr in December 2023, yet it remained significantly higher than previous years. Profit before tax showed a small increase, reaching 1,081.97 Cr in December 2024, and profit after tax also rose to 817.61 Cr. However, consolidated net profit dropped to 827.51 Cr from 1,125.15 Cr. On the balance sheet, total assets were 9,748.75 Cr in December 2024, with total liabilities remaining stable. Cash flow from operating activities decreased to 880.00 Cr, while net cash inflow improved to 91.00 Cr. The EPS fell to 21.81, indicating a decline in profitability per share. Overall, the company has shown both growth and challenges in its financial performance over the years.

View full answer

Is CIE Automotive overvalued or undervalued?

18-Sep-2025

As of September 17, 2025, CIE Automotive's valuation has shifted to attractive, with a PE ratio of 20.34, an EV to EBITDA of 12.02, and a ROCE of 14.62%, outperforming the Sensex recently despite a year-to-date decline.

As of 17 September 2025, the valuation grade for CIE Automotive has moved from very attractive to attractive, indicating a shift in market perception. The company is currently assessed as fairly valued. Key ratios include a PE ratio of 20.34, an EV to EBITDA of 12.02, and a ROCE of 14.62%. <BR><BR>In comparison to peers, CIE Automotive's PE ratio is significantly lower than Bharat Forge at 59.13 and Sona BLW Precision at 44.67, while also being more favorable than Electrost Castings at 10.81. The recent stock performance shows a 4.54% return over the past week, outperforming the Sensex's 1.56%, suggesting some positive momentum despite a year-to-date decline of 10.64% compared to the Sensex's gain of 5.83%.

View full answer

Who are the top shareholders of the CIE Automotive?

06-Jun-2025

The top shareholders of CIE Automotive include Participaciones Internacionales Autometal, Dos S.L. with 65.7%, mutual funds with 20.12%, Foreign Institutional Investors at 4.37%, HDFC Trustee Company Limited holding 9.46%, and individual investors at 6.59%.

The top shareholders of CIE Automotive include Promoters, with the largest holding being Participaciones Internacionales Autometal, Dos S.l, which owns 65.7% of the company. Additionally, mutual funds collectively hold 20.12% through 17 different schemes. Foreign Institutional Investors (FIIs) have a stake of 4.37%, while the highest public shareholder is HDFC Trustee Company Limited, which manages several funds and holds 9.46%. Individual investors account for 6.59% of the shareholding.

View full answer

Has CIE Automotive declared dividend?

06-Jun-2025

CIE Automotive India Ltd has declared a 70% dividend, amounting to ₹7 per share, with an ex-date of April 23, 2025. While recent returns have been negative, the company has shown significant growth over the past 3 to 5 years.

CIE Automotive India Ltd has declared a 70% dividend.<BR><BR>Dividend Details:<BR>- Percentage announced: 70%<BR>- Amount per share: 7 per share<BR>- Ex-date: 23 Apr 25<BR><BR>Dividend Yield: 2.66%.<BR><BR>Total Returns by Period:<BR>Over the last 6 months, the price return was -7.35%, the dividend return was 1.45%, resulting in a total return of -5.9%.<BR><BR>In the last year, the price return was -18.01%, the dividend return was 2.14%, leading to a total return of -15.87%.<BR><BR>Over the past 2 years, the price return was -9.27%, the dividend return was 2.28%, culminating in a total return of -6.99%.<BR><BR>In the last 3 years, the price return was 130.0%, the dividend return was 6.96%, resulting in a total return of 136.96%.<BR><BR>Over the past 4 years, the price return was 97.28%, the dividend return was 7.50%, leading to a total return of 104.78%.<BR><BR>In the last 5 years, the price return was 322.07%, the dividend return was 14.57%, culminating in a total return of 336.64%.<BR><BR>Overall, CIE Automotive has declared a substantial dividend, and while recent returns over shorter periods have been negative, the longer-term returns show significant growth, particularly in the last 3 to 5 years.

View full answer
iScoreScore
Click here to find our call on this stock
Strong Sell
Sell
Hold
Buy
Strong Buy

Dashboard

1

Company has a Debt to Equity ratio (avg) of 0.05 times

 
2

Poor long term growth as Net Sales has grown by an annual rate of 4.86% over the last 5 years

 
3

Flat results in Jun 26

4

With ROE of 11.6, it has a Very Attractive valuation with a 2 Price to Book Value

5

High Institutional Holdings at 25.65%

stock-summaryMojo Parameters

Mojo Parameters

Loading Valuation Snapshot...

Stock DNA

stock-summary
Industry

Auto Components & Equipments

stock-summary
Market cap

INR 15,645 Cr (Small Cap)

stock-summary
P/E

17.00

stock-summary
Industry P/E

49

stock-summary
Dividend Yield

1.72%

stock-summary
Debt Equity

-0.06

stock-summary
Return on Equity

11.60%

stock-summary
Price to Book

2.00

Revenue and Profits:
Net Sales:
2,621 Cr
(Quarterly Results - Jun 2026)
Net Profit:
236 Cr
stock-summaryTotal Returns
Total Returns (Price + Dividend) stock-summary
Dividend Yield (1.72%)
TimePeriod
Price Return
Dividend Return
Total Return
3 Months
-13.22%
0%
-13.22%
6 Months
0.88%
1.67%
2.55%
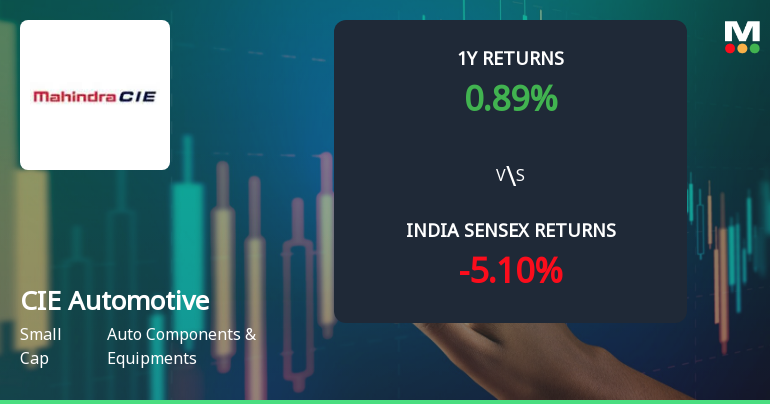
1 Year
1.88%
1.72%
3.6%
2 Years
-29.34%
2.56%
-26.78%
3 Years
-12.95%
3.91%
-9.04%
4 Years
53.19%
7.88%
61.07%
5 Years
50.92%
10.92%
61.84%

Latest dividend: 7 per share ex-dividend date: Apr-22-2026

Risk Adjusted Returns v/s stock-summary
Returns Beta
Icon
Beta has not been calculated since enough price history is not available
stock-summaryNews & Corporate Actions

News

Announcements stock-summary

Announcement under Regulation 30 (LODR)-Analyst / Investor Meet - Outcome

27-Jul-2026 | Source : BSE

Pursuant to Regulation 30 read with Para A of Schedule III and Regulation 46(2) the Securities and Exchange Board of India (Listing Obligations and Disclosure Requirements) Regulations 2015 and our letter dated 14th July 2026 in respect of advance intimation in relation to Q2 CY2026 Results Conference Call please find enclosed herewith transcripts of the said call held on 23rd July 2026.

Announcement under Regulation 30 (LODR)-Newspaper Publication

24-Jul-2026 | Source : BSE

Newspaper Publication of Unaudited Financial Results for the Quarter and Half Year Ended 30th June 2026.

Announcement under Regulation 30 (LODR)-Analyst / Investor Meet - Outcome

23-Jul-2026 | Source : BSE

This is further to our letter dated 14th July 2026 (advance intimation for Q2CY2026 Results Conference Call) and letter dated 22nd July 2026 (Investor Presentation on Q2CY2026 Results) we have made available the audio recording of the Q2CY2026 Results Conference Call held today i.e. 23rd July 2026 on the website of the Company at the following weblink: https://www.cie-india.com/periodic-public-information8.html#Quarterly-Result-Callsand-Transcripts

Corporate Actions stock-summary

stock-summary
BOARD MEETING

No Upcoming Board Meetings

stock-summary
DIVIDEND

CIE Automotive India Ltd has declared 70% dividend, ex-date: 22 Apr 26

stock-summary
SPLITS

No Splits history available

stock-summary
BONUS

No Bonus history available

stock-summary
RIGHTS

No Rights history available

stock-summaryKey Factors

Quality key factors stock-summary

Factor
Value
Sales Growth (5y)
4.86%
EBIT Growth (5y)
13.20%
EBIT to Interest (avg)
20.48
Debt to EBITDA (avg)
0.43
Net Debt to Equity (avg)
-0.06
Sales to Capital Employed (avg)
1.28
Tax Ratio
23.86%
Dividend Payout Ratio
32.07%
Pledged Shares
0
Institutional Holding
25.65%
ROCE (avg)
16.93%
ROE (avg)
11.82%

Valuation key factors

Factor
Value
P/E Ratio
17
Industry P/E
49
Price to Book Value
2.00
EV to EBIT
13.61
EV to EBITDA
10.15
EV to Capital Employed
2.06
EV to Sales
1.50
PEG Ratio
1.19
Dividend Yield
1.72%
ROCE (Latest)
15.12%
ROE (Latest)
11.60%

Technicals key factors

Indicator
Weekly
Monthly
MACD
Bearish
Bullish
RSI
No Signal
No Signal
Bollinger Bands
Bearish
Bearish
Moving Averages
Mildly Bullish (Daily)
KST
Bearish
Mildly Bullish
Dow Theory
No Trend
Mildly Bearish
OBV
Mildly Bearish
Mildly Bearish
stock-summary Technical Indicator Scale: Bearish, Mildly Bearish, Sideways, Mildly Bullish, Bullish  Turned 
stock-summaryShareholding
Shareholding Snapshot : Jun 2026stock-summary
Shareholding Compare (%holding) stock-summary
Majority shareholders

Promoters

Pledged Promoter Holdings

None

Mutual Funds

Held by 24 Schemes (19.5%)

FIIs

Held by 159 FIIs (4.95%)

Promoter with highest holding

Participaciones Internacionales Autometal, Dos S.l (65.7%)

Highest Public shareholder

Hdfc Trustee Company Limited Hdfc Flexi Cap Fund,hdfc Multi-asset Fun,hdfc Large And Mid Cap Fund,hd (9.75%)

Individual Investors Holdings

6.37%

stock-summaryFinancial
[
  {
    "link": "quarterly",
    "btn_text": "All Quarterly Results",
    "header": "Quarterly Results Snapshot (Consolidated) - Jun'26 - YoY",
    "rhs": [
      {
        "prefix": "Net Sales ",
        "suffix": "YoY Growth in quarter ended Jun 2026 is 10.62% vs 3.33% in Jun 2025",
        "dir": 1
      },
      {
        "prefix": "Consolidated Net Profit ",
        "suffix": "YoY Growth in quarter ended Jun 2026 is 15.77% vs -6.13% in Jun 2025",
        "dir": 1
      }
    ],
    "table": {
      "header": [
        "Jun'26",
        "Jun'25",
        "Change(%)"
      ],
      "body": [
        {
          "field": "Net Sales",
          "val1": "2,620.55",
          "val2": "2,369.00",
          "chgp": "10.62%",
          "chgp_class": "positive"
        },
        {
          "field": "Operating Profit (PBDIT) excl Other Income",
          "val1": "389.66",
          "val2": "336.75",
          "chgp": "15.71%",
          "chgp_class": "positive"
        },
        {
          "field": "Interest",
          "val1": "10.17",
          "val2": "1.65",
          "chgp": "516.36%",
          "chgp_class": "negative"
        },
        {
          "field": "Exceptional Items",
          "val1": "1.16",
          "val2": "0.52",
          "chgp": "123.08%",
          "chgp_class": "positive"
        },
        {
          "field": "Consolidate Net Profit",
          "val1": "235.62",
          "val2": "203.53",
          "chgp": "15.77%",
          "chgp_class": "positive"
        },
        {
          "field": "Operating Profit Margin (Excl OI)",
          "val1": "14.87%",
          "val2": "14.21%",
          "chgp": "0.66%",
          "chgp_class": "positive"
        }
      ]
    }
  },
  {
    "link": "half-yearly",
    "btn_text": "All Half Yearly Results",
    "header": "Half Yearly Results Snapshot (Consolidated) - Jun'26",
    "rhs": [
      {
        "prefix": "Net Sales ",
        "suffix": " Growth in half year ended Jun 2026 is 12.73% vs -1.65% in Jun 2025",
        "dir": 1
      },
      {
        "prefix": "Consolidated Net Profit ",
        "suffix": " Growth in half year ended Jun 2026 is 18.31% vs -8.35% in Jun 2025",
        "dir": 1
      }
    ],
    "table": {
      "header": [
        "Jun'26",
        "Jun'25",
        "Change(%)"
      ],
      "body": [
        {
          "field": "Net Sales",
          "val1": "5,232.50",
          "val2": "4,641.63",
          "chgp": "12.73%",
          "chgp_class": "positive"
        },
        {
          "field": "Operating Profit (PBDIT) excl Other Income",
          "val1": "791.59",
          "val2": "672.23",
          "chgp": "17.76%",
          "chgp_class": "positive"
        },
        {
          "field": "Interest",
          "val1": "19.35",
          "val2": "14.28",
          "chgp": "35.50%",
          "chgp_class": "negative"
        },
        {
          "field": "Exceptional Items",
          "val1": "2.47",
          "val2": "0.92",
          "chgp": "168.48%",
          "chgp_class": "positive"
        },
        {
          "field": "Consolidate Net Profit",
          "val1": "484.98",
          "val2": "409.93",
          "chgp": "18.31%",
          "chgp_class": "positive"
        },
        {
          "field": "Operating Profit Margin (Excl OI)",
          "val1": "15.13%",
          "val2": "14.48%",
          "chgp": "0.65%",
          "chgp_class": "positive"
        }
      ]
    }
  },
  {
    "link": "nine-monthly",
    "btn_text": "All Nine Monthly Results",
    "header": "Nine Monthly Results Snapshot (Consolidated) - Sep'25",
    "rhs": [
      {
        "prefix": "Net Sales ",
        "suffix": "YoY Growth in nine months ended Sep 2025 is 2.32% vs -2.64% in Sep 2024",
        "dir": 1
      },
      {
        "prefix": "Consolidated Net Profit ",
        "suffix": "YoY Growth in nine months ended Sep 2025 is -2.90% vs -32.81% in Sep 2024",
        "dir": 1
      }
    ],
    "table": {
      "header": [
        "Sep'25",
        "Sep'24",
        "Change(%)"
      ],
      "body": [
        {
          "field": "Net Sales",
          "val1": "7,013.47",
          "val2": "6,854.12",
          "chgp": "2.32%",
          "chgp_class": "positive"
        },
        {
          "field": "Operating Profit (PBDIT) excl Other Income",
          "val1": "1,027.88",
          "val2": "1,051.16",
          "chgp": "-2.21%",
          "chgp_class": "negative"
        },
        {
          "field": "Interest",
          "val1": "17.85",
          "val2": "60.06",
          "chgp": "-70.28%",
          "chgp_class": "positive"
        },
        {
          "field": "Exceptional Items",
          "val1": "1.69",
          "val2": "1.25",
          "chgp": "35.20%",
          "chgp_class": "positive"
        },
        {
          "field": "Consolidate Net Profit",
          "val1": "623.87",
          "val2": "642.53",
          "chgp": "-2.90%",
          "chgp_class": "negative"
        },
        {
          "field": "Operating Profit Margin (Excl OI)",
          "val1": "14.66%",
          "val2": "15.34%",
          "chgp": "-0.68%",
          "chgp_class": "negative"
        }
      ]
    }
  },
  {
    "link": "annual",
    "btn_text": "All Annual Results",
    "header": "Annual Results Snapshot (Consolidated) - Dec'25",
    "rhs": [
      {
        "prefix": "Net Sales ",
        "suffix": "YoY Growth in year ended Dec 2025 is 4.94% vs -3.41% in Dec 2024",
        "dir": 1
      },
      {
        "prefix": "Consolidated Net Profit ",
        "suffix": "YoY Growth in year ended Dec 2025 is 0.08% vs -26.45% in Dec 2024",
        "dir": 1
      }
    ],
    "table": {
      "header": [
        "Dec'25",
        "Dec'24",
        "Change(%)"
      ],
      "body": [
        {
          "field": "Net Sales",
          "val1": "9,406.47",
          "val2": "8,964.07",
          "chgp": "4.94%",
          "chgp_class": "positive"
        },
        {
          "field": "Operating Profit (PBDIT) excl Other Income",
          "val1": "1,362.46",
          "val2": "1,350.58",
          "chgp": "0.88%",
          "chgp_class": "positive"
        },
        {
          "field": "Interest",
          "val1": "26.52",
          "val2": "77.60",
          "chgp": "-65.82%",
          "chgp_class": "positive"
        },
        {
          "field": "Exceptional Items",
          "val1": "5.20",
          "val2": "7.21",
          "chgp": "-27.88%",
          "chgp_class": "negative"
        },
        {
          "field": "Consolidate Net Profit",
          "val1": "828.17",
          "val2": "827.51",
          "chgp": "0.08%",
          "chgp_class": "positive"
        },
        {
          "field": "Operating Profit Margin (Excl OI)",
          "val1": "14.48%",
          "val2": "15.07%",
          "chgp": "-0.59%",
          "chgp_class": "negative"
        }
      ]
    }
  }
]

Quarterly Results Snapshot (Consolidated) - Jun'26 - YoYstock-summary

Jun'26
Jun'25
Change(%)
Net Sales
2,620.55
2,369.00
10.62%
Operating Profit (PBDIT) excl Other Income
389.66
336.75
15.71%
Interest
10.17
1.65
516.36%
Exceptional Items
1.16
0.52
123.08%
Consolidate Net Profit
235.62
203.53
15.77%
Operating Profit Margin (Excl OI)
14.87%
14.21%
0.66%
Values in Rs Cr.
Direction Arrows
Net Sales

YoY Growth in quarter ended Jun 2026 is 10.62% vs 3.33% in Jun 2025

Direction Arrows
Consolidated Net Profit

YoY Growth in quarter ended Jun 2026 is 15.77% vs -6.13% in Jun 2025

Half Yearly Results Snapshot (Consolidated) - Jun'26stock-summary

Jun'26
Jun'25
Change(%)
Net Sales
5,232.50
4,641.63
12.73%
Operating Profit (PBDIT) excl Other Income
791.59
672.23
17.76%
Interest
19.35
14.28
35.50%
Exceptional Items
2.47
0.92
168.48%
Consolidate Net Profit
484.98
409.93
18.31%
Operating Profit Margin (Excl OI)
15.13%
14.48%
0.65%
Values in Rs Cr.
Direction Arrows
Net Sales

Growth in half year ended Jun 2026 is 12.73% vs -1.65% in Jun 2025

Direction Arrows
Consolidated Net Profit

Growth in half year ended Jun 2026 is 18.31% vs -8.35% in Jun 2025

Nine Monthly Results Snapshot (Consolidated) - Sep'25stock-summary

Sep'25
Sep'24
Change(%)
Net Sales
7,013.47
6,854.12
2.32%
Operating Profit (PBDIT) excl Other Income
1,027.88
1,051.16
-2.21%
Interest
17.85
60.06
-70.28%
Exceptional Items
1.69
1.25
35.20%
Consolidate Net Profit
623.87
642.53
-2.90%
Operating Profit Margin (Excl OI)
14.66%
15.34%
-0.68%
Values in Rs Cr.
Direction Arrows
Net Sales

YoY Growth in nine months ended Sep 2025 is 2.32% vs -2.64% in Sep 2024

Direction Arrows
Consolidated Net Profit

YoY Growth in nine months ended Sep 2025 is -2.90% vs -32.81% in Sep 2024

Annual Results Snapshot (Consolidated) - Dec'25stock-summary

Dec'25
Dec'24
Change(%)
Net Sales
9,406.47
8,964.07
4.94%
Operating Profit (PBDIT) excl Other Income
1,362.46
1,350.58
0.88%
Interest
26.52
77.60
-65.82%
Exceptional Items
5.20
7.21
-27.88%
Consolidate Net Profit
828.17
827.51
0.08%
Operating Profit Margin (Excl OI)
14.48%
15.07%
-0.59%
Values in Rs Cr.
Direction Arrows
Net Sales

YoY Growth in year ended Dec 2025 is 4.94% vs -3.41% in Dec 2024

Direction Arrows
Consolidated Net Profit

YoY Growth in year ended Dec 2025 is 0.08% vs -26.45% in Dec 2024

stock-summaryCompany CV
About CIE Automotive India Ltd stock-summary
stock-summary
CIE Automotive India Ltd
Small Cap
Auto Components & Equipments
CIE Automotive India Limited was originally incorporated as a Public company under the name 'Mahindra Automotive Steels Limited' on August 13, 1999. On January 15, 2003, the Company was converted into a Private limited and the name of the Company was changed to Mahindra Automotive Steels Private Limited.
Company Coordinates stock-summary
Company Details
Suite F9D Grand Hyatt Plaza, Santacruz (E) Mumbai Maharashtra : 400055
stock-summary
Tel: 91-022-62411031
stock-summary
mcie.investors@mahindra.com
Registrar Details
Karvy Computershare Pvt Ltd., Karvy Selenium, Tower-B Plot No 31 & 32, Survey No 116/22, 115/24, 115/25, Financial District, Nanakramguda, Serilingampally, Mandal Ranga Reddy Dist, Hyderabad