
Compare City Pulse Multi with Similar Stocks
Stock DNA
Garments & Apparels
INR 3,146 Cr (Small Cap)
1,655.00
61
0.00%
-0.03
2.14%
35.70
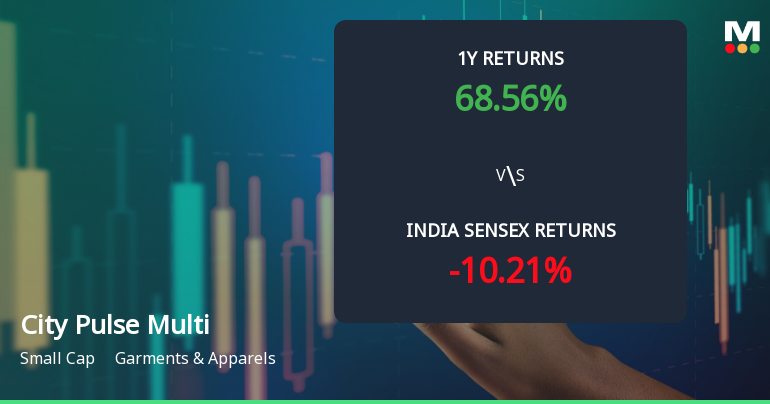
Total Returns (Price + Dividend) 
City Pulse Multi for the last several years.
Risk Adjusted Returns v/s
Returns Beta

News
City Pulse Multiventures Ltd Shows Mixed Technical Signals Amid Price Momentum Shift
City Pulse Multiventures Ltd, a small-cap player in the Garments & Apparels sector, has experienced a notable shift in its technical momentum, moving from a bearish to a mildly bearish trend. Despite a strong day gain of 4.87%, the stock’s technical indicators present a complex picture, reflecting mixed signals across weekly and monthly timeframes. This analysis delves into the recent price action, key technical indicators, and comparative returns to provide a comprehensive view for investors.
Read full news article
City Pulse Multiventures Ltd Upgraded to Sell on Improved Quality and Valuation Metrics
City Pulse Multiventures Ltd has seen its investment rating upgraded from Strong Sell to Sell as of 9 June 2026, reflecting notable improvements in quality metrics and valuation parameters despite ongoing challenges in technical trends and financial efficiency. This article analyses the key factors behind this rating change, providing investors with a comprehensive understanding of the company’s current standing within the Garments & Apparels sector.
Read full news article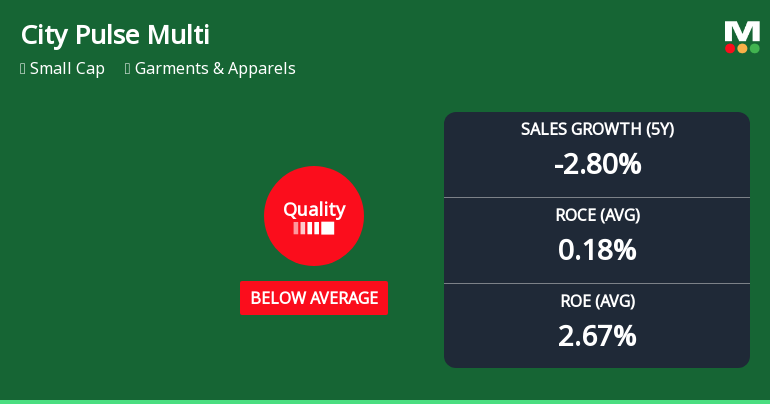
City Pulse Multiventures Ltd Quality Grade Upgrade Signals Mixed Business Fundamentals
City Pulse Multiventures Ltd, a small-cap player in the Garments & Apparels sector, has seen its quality grade improve from below average to average as of 9 June 2026, according to the latest MarketsMOJO assessment. Despite a modest Mojo Score of 36.0 and a Sell rating, this upgrade reflects nuanced changes in the company’s financial health, particularly in profitability, leverage, and operational efficiency metrics.
Read full news article Announcements
Closure of Trading Window
11-Jun-2026 | Source : BSEintimation of trading window closure
Board Meeting Intimation for Intimation Of Board Meeting
11-Jun-2026 | Source : BSECity Pulse Multiventures Ltdhas informed BSE that the meeting of the Board of Directors of the Company is scheduled on 20/06/2026 inter alia to consider and approve intimation of board meeting
Board Meeting Outcome for Approval Of Results
30-May-2026 | Source : BSEoutcome of board meeting
Corporate Actions

20 Jun 2026

No Dividend history available

No Splits history available

No Bonus history available

No Rights history available
Quality key factors
Valuation key factors
Technicals key factors
 Technical Indicator Scale: Bearish, Mildly Bearish, Sideways, Mildly Bullish, Bullish Turned
 Shareholding Snapshot : Mar 2026
Shareholding Compare (%holding)
Non Institution
None
Held by 0 Schemes
Held by 0 FIIs
Arpit Rajnikant Mehta (9.13%)
Aashirvad Vision Private Limited (5.19%)
74.3%
Quarterly Results Snapshot (Standalone) - Dec'25 - QoQ

QoQ Growth in quarter ended Dec 2025 is 25.42% vs 3.51% in Sep 2025
QoQ Growth in quarter ended Dec 2025 is 70.45% vs -20.00% in Sep 2025
Half Yearly Results Snapshot (Consolidated) - Sep'25

Growth in half year ended Sep 2025 is 27.62% vs 81.00% in Mar 2025
Growth in half year ended Sep 2025 is 16.47% vs 73.47% in Mar 2025
Nine Monthly Results Snapshot (Standalone) - Dec'25
YoY Growth in nine months ended Dec 2025 is 45.21% vs 521.43% in Dec 2024
YoY Growth in nine months ended Dec 2025 is 62.62% vs 923.08% in Dec 2024
Annual Results Snapshot (Standalone) - Mar'25
YoY Growth in year ended Mar 2025 is 144.35% vs 139.58% in Mar 2024
YoY Growth in year ended Mar 2025 is 793.33% vs 120.27% in Mar 2024
About City Pulse Multiventures Ltd

Company Coordinates


