
Compare Clean Max Enviro with Similar Stocks
Dashboard
High Management Efficiency with a high ROCE of 0%
Strong ability to service debt as the company has a low Debt to EBITDA ratio of 1.96 times
Healthy long term growth as Net Sales has grown by an annual rate of 0% and Operating profit at 0%
Flat results in Mar 26
With ROCE of 16.5, it has a Fair valuation with a 2.7 Enterprise value to Capital Employed
Total Returns (Price + Dividend) 
Clean Max Enviro for the last several years.
Risk Adjusted Returns v/s
Returns Beta

News
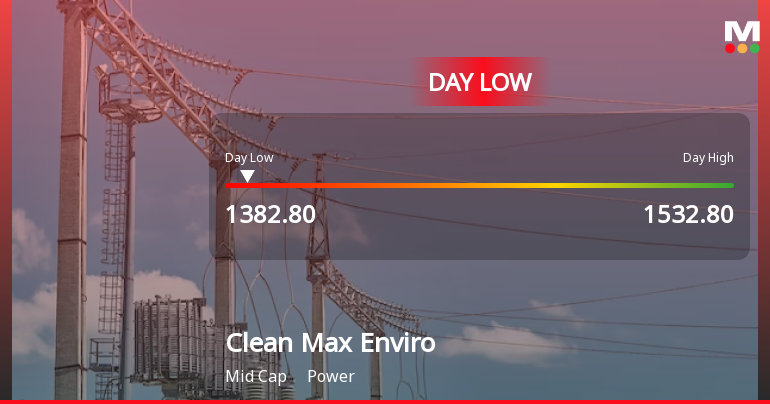
Clean Max Enviro Energy Solutions Ltd Hits Intraday Low Amid Price Pressure
Clean Max Enviro Energy Solutions Ltd experienced a notable intraday decline on 24 Jun 2026, touching a low of Rs 1,433, down 3.77% from its previous close. The stock underperformed the broader power sector and the Sensex, reflecting immediate price pressures despite earlier gains during the session.
Read full news article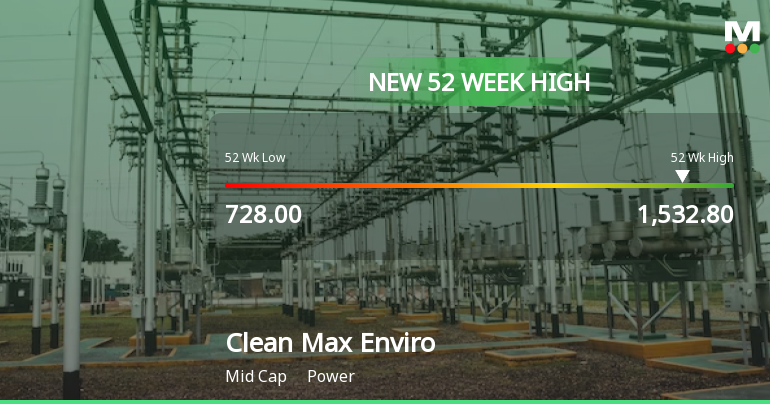
Broad-Based Technical Strength Lifts Clean Max Enviro Energy Solutions Ltd to 52-Week High of Rs 1532.8
With a decisive intraday surge to Rs 1532.8, Clean Max Enviro Energy Solutions Ltd has reached a fresh 52-week and all-time high, marking a significant milestone in its price momentum. This achievement comes amid a backdrop of broad technical alignment and sustained upward pressure across multiple moving averages.
Read full news article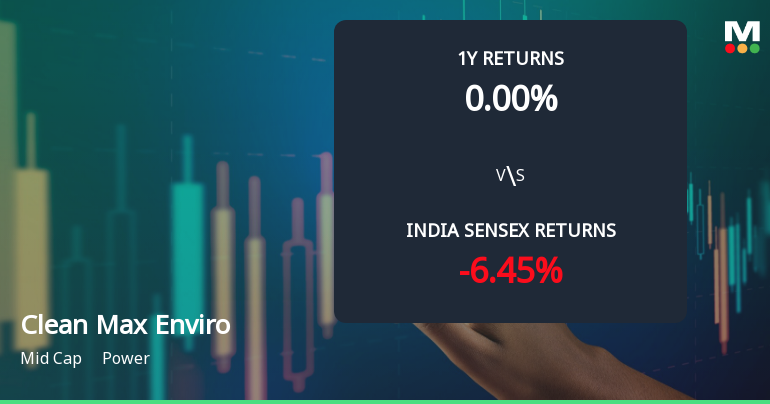
Clean Max Enviro Energy Solutions Ltd Shows Renewed Momentum Amid Technical Upgrades
Clean Max Enviro Energy Solutions Ltd has demonstrated a significant shift in price momentum, supported by a series of technical indicator upgrades that suggest a cautiously optimistic outlook for this mid-cap power sector stock. Following a recent upgrade from a Sell to a Hold rating, the stock’s technical profile has improved markedly, signalling a potential mild bullish trend after a period of sideways movement.
Read full news article Announcements
Corporate Actions

No Upcoming Board Meetings

No Dividend history available

No Splits history available

No Bonus history available

No Rights history available
Quality key factors
Valuation key factors
Technicals key factors
 Technical Indicator Scale: Bearish, Mildly Bearish, Sideways, Mildly Bullish, Bullish Turned
 Shareholding Snapshot : Mar 2026
Shareholding Compare (%holding)
Promoters
20.0202
Held by 8 Schemes (2.26%)
Held by 36 FIIs (29.8%)
Bgtf One Holdings (difc) Limited (21.31%)
Augment India I Holding Llc (9.52%)
3.32%
Quarterly Results Snapshot (Standalone) - Mar'26 - QoQ

QoQ Growth in quarter ended Mar 2026 is 24.69% vs 4.34% in Dec 2025

QoQ Growth in quarter ended Mar 2026 is -53.94% vs 13.07% in Dec 2025
Half Yearly Results Snapshot (Standalone) - Sep'25
Not Applicable: The company has declared_date for only one period
Not Applicable: The company has declared_date for only one period
Nine Monthly Results Snapshot (Standalone) - Dec'25
Not Applicable: The company has declared_date for only one period
Not Applicable: The company has declared_date for only one period
Annual Results Snapshot (Standalone) - Mar'26
YoY Growth in year ended Mar 2026 is 164.42% vs 7.78% in Mar 2025
YoY Growth in year ended Mar 2026 is 157.39% vs 5.57% in Mar 2025
About Clean Max Enviro Energy Solutions Ltd

Company Coordinates


