
Compare CMX Holdings with Similar Stocks
Dashboard
With a Negative Book Value, the company has a Weak Long Term Fundamental Strength
- Poor long term growth as Net Sales has grown by an annual rate of 0% and Operating profit at 0% over the last 5 years
- The company has a negative book value of Rs 5.95 crore
Flat results in Mar 26
Risky - Negative EBITDA
Falling Participation by Institutional Investors
Stock DNA
Non Banking Financial Company (NBFC)
INR 29 Cr (Micro Cap)
NA (Loss Making)
32
0.00%
-1.13
10.25%
-4.68
Total Returns (Price + Dividend) 
CMX Holdings for the last several years.
Risk Adjusted Returns v/s
Returns Beta

News
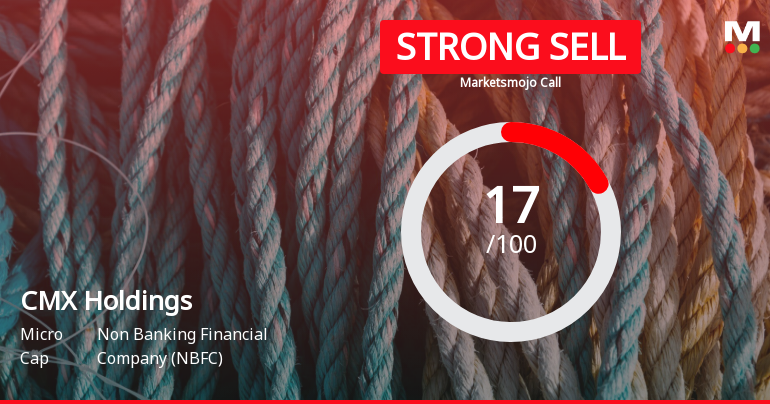
CMX Holdings Ltd is Rated Strong Sell
CMX Holdings Ltd is rated Strong Sell by MarketsMOJO, with this rating last updated on 15 April 2026. However, the analysis and financial metrics discussed here reflect the stock's current position as of 25 June 2026, providing investors with the latest insights into the company’s performance and outlook.
Read full news articleAre CMX Holdings Ltd latest results good or bad?
CMX Holdings Ltd's latest financial results reflect significant operational challenges and a precarious financial position. The company reported nil net sales for the fourth quarter of FY26, continuing a trend of zero revenue generation that has persisted for at least seven consecutive quarters. This lack of operational activity is underscored by a reported net loss of ₹0.22 crores, which represents a substantial deterioration compared to the previous year's loss. The operating loss before depreciation, interest, and tax widened slightly to ₹0.13 crores from ₹0.12 crores year-on-year, indicating ongoing difficulties in managing operational costs. Additionally, interest expenses surged to ₹0.10 crores, a notable increase from virtually nil in the prior year, further straining the company's financial resources. The balance sheet reveals a troubling picture, with negative shareholder equity of ₹5.68 crores a...
Read full news article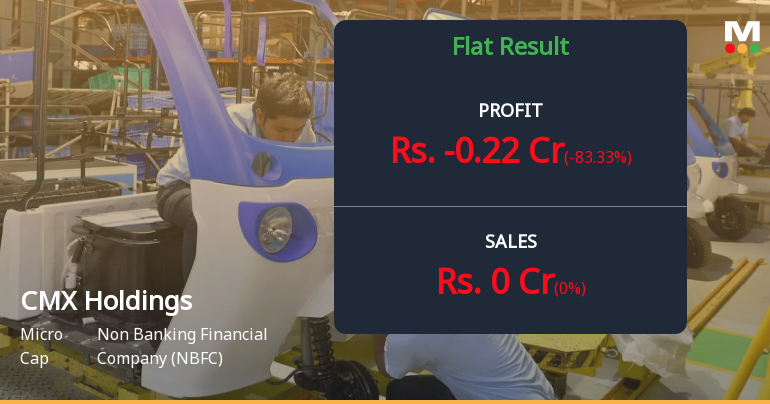
CMX Holdings Q4 FY26: Losses Deepen as Micro-Cap NBFC Struggles Without Revenue
CMX Holdings Ltd., a micro-cap non-banking financial company, reported a net loss of ₹0.22 crores in Q4 FY26 (Mar'26), marking an 83.33% deterioration from the ₹0.12 crore loss posted in Q4 FY25. The company continues to operate without generating any revenue, whilst accumulating operational losses quarter after quarter. With a market capitalisation of just ₹23.00 crores and a negative book value of ₹-5.02 per share, the stock surged 9.99% on June 19, 2026, to ₹20.36, though it remains 70.55% below its 52-week high of ₹69.13.
Read full news article Announcements
Clarification sought from CMX Holdings Ltd
24-Jun-2026 | Source : BSEThe Exchange has sought clarification from CMX Holdings Ltd on June 24 2026 with reference to significant movement in price in order to ensure that investors have latest relevant information about the company and to inform the market so that the interest of the investors is safeguarded.
The reply is awaited.
Results_Audited Financial Results For Forth Quarter And Year Ended March 31 2026
18-Jun-2026 | Source : BSEAudited Financial Results for March 31 2026
Board Meeting Intimation for To Consider Approve And Take On Record The Audited Financial Results Of The Company For The Quarter Ended And Financial Year Ended 31St March 2026.
15-Jun-2026 | Source : BSECMX Holdings Ltdhas informed BSE that the meeting of the Board of Directors of the Company is scheduled on 25/06/2026 inter alia to consider and approve To consider approve and take on record the audited financial results of the Company for the quarter ended and financial year ended 31st March 2026.
Corporate Actions

No Upcoming Board Meetings

No Dividend history available

No Splits history available

No Bonus history available

No Rights history available
Quality key factors
Valuation key factors
Technicals key factors
 Technical Indicator Scale: Bearish, Mildly Bearish, Sideways, Mildly Bullish, Bullish Turned
 Shareholding Snapshot : Dec 2025
Shareholding Compare (%holding)
Promoters
None
Held by 0 Schemes
Held by 3 FIIs (1.26%)
Amay Vatsalya (51.77%)
Raju Ajit Bhandari (1.94%)
37.12%
Quarterly Results Snapshot (Standalone) - Mar'26 - YoY
YoY Growth in quarter ended Mar 2026 is 0.00% vs 0.00% in Mar 2025

YoY Growth in quarter ended Mar 2026 is -83.33% vs 33.33% in Mar 2025
Half Yearly Results Snapshot (Standalone) - Sep'25
Growth in half year ended Sep 2025 is 0.00% vs 0.00% in Sep 2024
Growth in half year ended Sep 2025 is 0.00% vs 0.00% in Sep 2024
Nine Monthly Results Snapshot (Standalone) - Dec'25
YoY Growth in nine months ended Dec 2025 is 0.00% vs 0.00% in Dec 2024
YoY Growth in nine months ended Dec 2025 is -228.57% vs 0.00% in Dec 2024
Annual Results Snapshot (Standalone) - Mar'25
YoY Growth in year ended Mar 2025 is 0.00% vs 0.00% in Mar 2024

YoY Growth in year ended Mar 2025 is -38.89% vs -1,700.00% in Mar 2024
About CMX Holdings Ltd

Company Coordinates


