Coastal Corporat

INR
40.35
0.00 (0.00%)
BSENSE

Aug 27, 04:01 PM

BSE+NSE Vol: 44.16 k

  • Price Points
  • Score
  • Mojo Parameters
  • Total Return
  • News and Corporate Actions
  • Key factors
  • Shareholding
  • Financials
  • CompanyCV
stock-summaryPrice Point
High/Low

1Day

52 Week

Valuation
Technical
Day's Volume

CASH

44.16 k (-77.96%) Volume

Shareholding (Jun 2026)

FII

1.05%

Held by 6 FIIs

DII

1.03%

Held by 0 DIIs

Promoter

42.30%

Why is Coastal Corporation Ltd falling/rising?

27-Aug-2026

As of 26-Aug, Coastal Corporation Ltd's stock price is at 40.35, reflecting a decline of 0.81% and a total drop of 4.31% over the last two days. The stock has underperformed significantly over various time frames, trading below its moving averages and experiencing a notable decrease in investor participation.

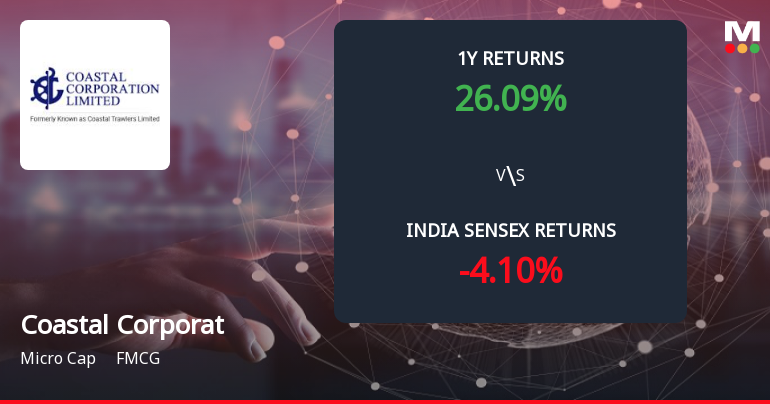
As of 26-Aug, Coastal Corporation Ltd's stock price is falling, currently at 40.35, which reflects a decrease of 0.33 or 0.81%. The stock has underperformed its sector by 1.7% today and has been on a consecutive decline for the last two days, resulting in a total drop of 4.31% during this period. <BR><BR>In terms of performance over various time frames, the stock has shown significant declines, with a 1-week drop of 4.68% and a 1-month decline of 19.30%. Year-to-date, it has decreased by 11.45%, although it has performed better over the past year with a gain of 26.09%. However, over longer periods, such as 3 years and 5 years, the stock has fallen by 29.42% and 19.33%, respectively, while the benchmark Sensex has shown positive returns in those periods.<BR><BR>Additionally, the stock is currently trading below its moving averages across all time frames (5-day, 20-day, 50-day, 100-day, and 200-day), indicating a bearish trend. There has also been a notable decline in investor participation, with delivery volume dropping by 47.63% compared to the 5-day average. This combination of factors contributes to the ongoing decline in Coastal Corporation Ltd's stock price.

View full answer

Should I buy, sell or hold Coastal Corporation Ltd?

26-Aug-2026

Who are in the management team of Coastal Corporat?

14-Aug-2026

The management team of Coastal Corporat includes Chairman Emandi Sankara Rao, Vice Chairman T Valsaraj, Executive Director G V V Satyanarayana, and several Non-Executive Directors: Jeeja Valsaraj, P R Kalyanaraman, K Venkateswara Rao, and M V Suryanarayana. This diverse team provides strong leadership and expertise to the company.

The management team of Coastal Corporat includes the following individuals:<BR><BR>1. **Emandi Sankara Rao** - Chairman & Independent Director<BR>2. **T Valsaraj** - Vice Chairman & Managing Director<BR>3. **G V V Satyanarayana** - Executive Director / Whole-Time Director - Finance<BR>4. **Jeeja Valsaraj** - Non-Executive Director<BR>5. **P R Kalyanaraman** - Independent Non-Executive Director<BR>6. **K Venkateswara Rao** - Independent Non-Executive Director<BR>7. **M V Suryanarayana** - Independent Non-Executive Director<BR><BR>This team brings a diverse range of expertise and leadership to the company.

View full answer

What does Coastal Corporat do?

14-Aug-2026

Coastal Corporation Ltd is a Micro Cap company focused on shrimp processing and export in the FMCG industry. As of June 2026, it reported net sales of 254 Cr and a net profit of 12 Cr.

Overview:<BR>Coastal Corporation Ltd is an Export-Oriented Unit specializing in shrimp processing and export within the FMCG industry, categorized as a Micro Cap company.<BR><BR>History:<BR>Coastal Corporation Ltd was originally incorporated as Coastal Trawlers Private Limited in May 1981, transitioned to a public limited company as Coastal Trawlers Limited in 1985, and adopted its current name in 2005. The latest quarterly results reported net sales and profit for June 2026.<BR><BR>Financial Snapshot:<BR>- Net Sales: 254 Cr (Quarterly Results - Jun 2026)<BR>- Net Profit: 12 Cr (Quarterly Results - Jun 2026)<BR>- Market Cap: INR 283 Cr (Micro Cap)<BR><BR>Key Metrics:<BR>- P/E: 9.00<BR>- Industry P/E: 19<BR>- Dividend Yield: 0.00%<BR>- Debt Equity: 1.45<BR>- Return on Equity: 9.31%<BR>- Price to Book: 0.99<BR><BR>Contact Details:<BR>Address: 15-1-37/3 Nowroji Road, Jayaprada Apts Maharanipeta Visakhapatnam Andhra Pradesh : 530002<BR>Tel: 91-891-2567118/2552556<BR>Email: coastal6@eth.net / cclinvestors@gma<BR>Website: http://www.coastalcorp.co.in

View full answer

Who are the peers of the Coastal Corporat?

14-Aug-2026

Coastal Corporat's peers include Gujjubhai Indust, Chatha Foods, Wardwizard Foods, Kings Infra, Aveer Foods, Annapurna Swadi, Maxvolt Energy, and Hoac Foods. Coastal Corporat has average management risk, below average growth, and below average capital structure compared to its peers, with a 1-year return of 27.04%.

Peers: The peers of Coastal Corporat are Gujjubhai Indust, Chatha Foods, Wardwizard Foods, Kings Infra, Aveer Foods, Annapurna Swadi., Maxvolt Energy, and Hoac Foods.<BR><BR>Quality Snapshot: Excellent management risk is observed at Gujjubhai Indust, Maxvolt Energy, and Hoac Foods, while Average management risk is found at Coastal Corporat, Chatha Foods, Kings Infra, Annapurna Swadi., and the rest. Below Average management risk is noted at Wardwizard Foods and Aveer Foods. For growth, Excellent growth is seen at Gujjubhai Indust, Kings Infra, Annapurna Swadi., and the rest, while Good growth is found at Chatha Foods, Wardwizard Foods, Aveer Foods, and the rest. Coastal Corporat shows Below Average growth. In terms of Capital Structure, Excellent is noted at Gujjubhai Indust, Kings Infra, Maxvolt Energy, and the rest, while Good is seen at Chatha Foods, Aveer Foods, and the rest. Coastal Corporat has Below Average capital structure, and Wardwizard Foods has Below Average as well.<BR><BR>Return Snapshot: The peer with the highest 1-year return is Wardwizard Foods at 168.15%, while Coastal Corporat has a 1-year return of 27.04%, which is significantly lower than Wardwizard Foods. The peer with the lowest 1-year return is Gujjubhai Indust at -41.73%. Additionally, Aveer Foods and Kings Infra have negative six-month returns.

View full answer

How big is Coastal Corporat?

14-Aug-2026

As of 14th August, Coastal Corporation Ltd has a market capitalization of 277.82 Cr, with recent net sales of 1040.88 Cr and a net profit of 32.23 Cr. The company has shareholder's funds of 283.69 Cr and total assets of 840.97 Cr.

As of 14th August, Coastal Corporation Ltd has a market capitalization of 277.82 Cr, categorizing it as a Micro Cap company.<BR><BR>In the latest four quarters, Coastal Corporation reported Net Sales of 1040.88 Cr and a Net Profit of 32.23 Cr.<BR><BR>For the reporting period of March 2026, the company has Shareholder's Funds amounting to 283.69 Cr and Total Assets of 840.97 Cr.

View full answer

Are Coastal Corporation Ltd latest results good or bad?

04-Aug-2026

Coastal Corporation Ltd's latest results show strong revenue growth of 38.23% and a net profit increase of 100.87%, marking a record quarterly profit. However, concerns about declining operating margins, low return on capital employed, high debt levels, and reliance on non-operating income suggest investors should be cautiously optimistic.

Coastal Corporation Ltd's latest results present a mixed picture. On one hand, the company reported a significant year-on-year revenue growth of 38.23%, reaching ₹253.88 crores, and a net profit of ₹11.57 crores, which is a remarkable 100.87% increase compared to the previous year. This marks the highest quarterly profit in the company's recent history, indicating strong demand for its shrimp products, particularly in export markets.<BR><BR>However, there are notable concerns. The operating margin has slightly declined by 54 basis points year-on-year to 8.22%, suggesting that while revenue has increased, operational efficiency may be under pressure. Additionally, the company's return on capital employed (ROCE) remains low, averaging just 3.52% over the past five years, indicating potential inefficiencies in capital utilization. The reliance on non-operating income, which constituted a significant portion of profit before tax, raises questions about the sustainability of this profit growth.<BR><BR>Furthermore, Coastal Corporation is facing elevated debt levels, with interest expenses climbing significantly, which could pose risks to its financial stability. The interest coverage ratio is weak, indicating challenges in servicing debt obligations.<BR><BR>In summary, while the headline figures of revenue and profit growth are impressive, the underlying structural challenges, including low operational efficiency and high leverage, suggest that investors should approach with cautious optimism.

View full answer

When is the next results date for Coastal Corporation Ltd?

24-Jul-2026

The next results date for Coastal Corporation Ltd is August 3, 2026.

The next results date for Coastal Corporation Ltd is scheduled for August 3, 2026.

View full answer

How has been the historical performance of Coastal Corporat?

21-Nov-2025

Coastal Corporat has shown significant growth in net sales and operating income from INR 352.72 Cr in Mar'23 to INR 628.22 Cr in Mar'25, but profitability metrics have declined, with profit after tax dropping from INR 6.70 Cr to INR 4.48 Cr, and cash flow from operations turning negative in Mar'24. Total liabilities and debt have also increased during this period, indicating financial challenges despite sales growth.

Answer:<BR>The historical performance of Coastal Corporat shows a fluctuating trend in key financial metrics over the years.<BR><BR>Breakdown:<BR>Coastal Corporat's net sales have increased significantly from INR 352.72 Cr in Mar'23 to INR 628.22 Cr in Mar'25, indicating strong growth. However, the total operating income also reflects this trend, rising from INR 352.72 Cr in Mar'23 to INR 628.22 Cr in Mar'25. The raw material costs have surged from INR 209.59 Cr in Mar'23 to INR 463.87 Cr in Mar'25, contributing to a total expenditure increase from INR 332.89 Cr in Mar'23 to INR 597.69 Cr in Mar'25. Despite the rise in sales, the operating profit (PBDIT) has shown a modest increase from INR 19.83 Cr in Mar'23 to INR 30.53 Cr in Mar'25, while profit before tax has decreased from INR 10.76 Cr in Mar'23 to INR 7.51 Cr in Mar'25. The profit after tax has also declined from INR 6.70 Cr in Mar'23 to INR 4.48 Cr in Mar'25. The company's total liabilities have increased from INR 443.27 Cr in Mar'23 to INR 750.44 Cr in Mar'25, with total debt rising from INR 174.48 Cr to INR 409.96 Cr in the same period. Cash flow from operating activities has been negative in Mar'24 at INR -62.00 Cr, while cash flow from financing activities has improved significantly to INR 151.00 Cr. Overall, while Coastal Corporat has experienced growth in sales and operating income, profitability metrics and cash flow indicate challenges that the company faces.

View full answer

Who are the top shareholders of the Coastal Corporat?

17-Jul-2025

The top shareholder of Coastal Corporat is Thottoli Valsaraj, with a 12.17% stake. Individual investors hold 42.98%, while the highest public shareholder is Pinakin Chimanlal Shah at 2.56%, and there are no pledged promoter holdings or mutual funds involved.

The top shareholders of Coastal Corporat include Thottoli Valsaraj, who holds the highest stake at 12.17%. The company has a significant portion of individual investors, accounting for 42.98% of the holdings. Additionally, there are two foreign institutional investors (FIIs) that collectively hold 0.94%. The highest public shareholder is Pinakin Chimanlal Shah, with a holding of 2.56%. Notably, there are no pledged promoter holdings or mutual funds involved in the shareholding structure.

View full answer

Is Coastal Corporat overvalued or undervalued?

09-Jun-2025

As of March 21, 2024, Coastal Corporat's valuation has improved to attractive, indicating it is currently undervalued despite a high PE Ratio of 58.87 compared to peers like Avanti Feeds and Mukka Proteins, while its recent stock performance has outpaced the Sensex.

As of 21 March 2024, the valuation grade for Coastal Corporat has moved from fair to attractive, indicating a shift in its perceived value. The company is currently considered undervalued. Key ratios include a PE Ratio of 58.87, an EV to EBITDA of 20.49, and a Price to Book Value of 1.00, which suggest that while the company has a high earnings multiple, its asset valuation is reasonable.<BR><BR>In comparison to its peers, Coastal Corporat's PE Ratio is significantly higher than Avanti Feeds at 19.15 and Mukka Proteins at 20.24, both of which are also rated attractive. This indicates that Coastal may be overvalued relative to its earnings potential when compared to these peers. Additionally, the company's recent stock performance has outpaced the Sensex over the past week and month, with returns of 3.85% and 14.19%, respectively, which may reflect positive market sentiment despite its longer-term underperformance.

View full answer

What is the technical trend for Coastal Corporat?

09-Jun-2025

As of May 23, 2025, Coastal Corporat's trend is mildly bearish, with daily moving averages indicating bearish sentiment, while weekly indicators show mild bullishness, suggesting caution due to mixed signals in the market.

As of 23 May 2025, the technical trend for Coastal Corporat has changed from bearish to mildly bearish. The current stance is mildly bearish, driven by the daily moving averages indicating a bearish sentiment, while the weekly MACD and KST show a mildly bullish signal, suggesting some potential upward momentum. However, the monthly indicators, including MACD and Bollinger Bands, remain bearish, indicating ongoing weakness in the longer time frame. The RSI shows no signal, and the Dow Theory indicates a mildly bullish trend on the weekly chart but no trend on the monthly. Overall, the mixed signals suggest caution in the current market environment.

View full answer

What is the bonus history of the Coastal Corporat?

06-Jun-2025

Coastal Corporation's bonus history includes a 3:1 bonus issue announced on May 23, 2018, and a 1:1 bonus issued on September 29, 2015.

Coastal Corporation has a history of bonus issues that includes two notable instances. The most recent bonus was a 3:1 bonus issue, which was announced with an ex-date of May 23, 2018, and a record date of May 24, 2018. Prior to that, the company issued a 1:1 bonus on September 29, 2015, with a record date of October 1, 2015. If you need more details or have further questions about the company, feel free to ask!

View full answer

Has Coastal Corporat declared dividend?

06-Jun-2025

Coastal Corporation Ltd has declared a 12% dividend, amounting to 1.2 per share, with an ex-date of September 20, 2024. While the dividend yield is 0.61%, total returns over various periods have been mixed, with some showing negative performance despite the dividends.

Coastal Corporation Ltd has declared a 12% dividend.<BR><BR>Dividend Details:<BR>- Percentage announced: 12%<BR>- Amount per share: 1.2<BR>- Ex-date: 20 Sep 24<BR><BR>Dividend Yield: 0.61%.<BR><BR>Total Returns by Period:<BR>Over the past 6 months, the price return was -17.14%, with a dividend return of 0%, resulting in a total return of -17.14%.<BR><BR>For the 1-year period, the price return was -9.47%, the dividend return was 2.57%, leading to a total return of -6.9%.<BR><BR>In the 2-year period, the price return was -1.04%, the dividend return was 6.05%, culminating in a total return of 5.01%.<BR><BR>During the 3-year period, the price return was -20.48%, the dividend return was 5.22%, resulting in a total return of -15.26%.<BR><BR>For the 4-year period, the price return was -25.14%, the dividend return was 13.01%, leading to a total return of -12.13%.<BR><BR>Over the 5-year period, the price return was -6.43%, the dividend return was 14.91%, resulting in a total return of 8.48%.<BR><BR>Overall, Coastal Corporation Ltd has declared a substantial dividend, but the total returns over various periods show a mixed performance, with some periods experiencing negative returns despite the dividends.

View full answer
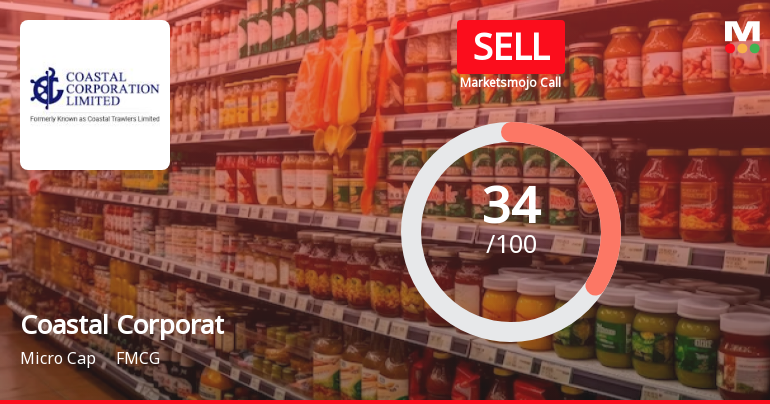
iScoreScore
Click here to find our call on this stock
Strong Sell
Sell
Hold
Buy
Strong Buy

Dashboard

1

Weak Long Term Fundamental Strength with an average Return on Capital Employed (ROCE) of 3.69%

  • Poor long term growth as Operating profit has grown by an annual rate 18.14% of over the last 5 years
  • Low ability to service debt as the company has a high Debt to EBITDA ratio of 7.95 times
stock-summaryMojo Parameters

Mojo Parameters

Loading Valuation Snapshot...

Stock DNA

stock-summary
Industry

FMCG

stock-summary
Market cap

INR 271 Cr (Micro Cap)

stock-summary
P/E

8.00

stock-summary
Industry P/E

15

stock-summary
Dividend Yield

0.70%

stock-summary
Debt Equity

1.45

stock-summary
Return on Equity

9.31%

stock-summary
Price to Book

0.94

Revenue and Profits:
Net Sales:
254 Cr
(Quarterly Results - Jun 2026)
Net Profit:
12 Cr
stock-summaryTotal Returns
Total Returns (Price + Dividend) stock-summary
Dividend Yield (0.7%)
TimePeriod
Price Return
Dividend Return
Total Return
3 Months
-33.85%
0.46%
-33.39%
6 Months
-11.32%
0.65%
-10.67%
1 Year
26.09%
0.91%
27.0%
2 Years
-28.72%
0.95%
-27.77%
3 Years
-29.42%
1.49%
-27.93%
4 Years
-44.73%
1.19%
-43.54%
5 Years
-17.69%
2.40%
-15.29%

Latest dividend: 0.28 per share ex-dividend date: Aug-20-2026

Risk Adjusted Returns v/s stock-summary
Returns Beta
Icon
Beta has not been calculated since enough price history is not available
stock-summaryNews & Corporate Actions

News

Announcements stock-summary

Intimation Regarding Receipt Of Incremental Allocation For Supply Of Ethanol To Omcs Under Ethanol Blended Petrol Programme (EBPP)

20-Aug-2026 | Source : BSE

Intimation regarding receipt of incremental allocation for supply of Ethanol to OMCs under Ethanol Blended Petrol Programme (EBPP)

Clarification Regarding Repayment Of Banking Facilities With DBS Bank.

08-Aug-2026 | Source : BSE

Clarification regarding repayment of Banking Facilities with DBS Bank.

Announcement under Regulation 30 (LODR)-Credit Rating

07-Aug-2026 | Source : BSE

Intimation regarding Credit Rating of Coastal Corporation Limited

Corporate Actions stock-summary

stock-summary
BOARD MEETING

No Upcoming Board Meetings

stock-summary
DIVIDEND

Coastal Corporation Ltd has declared 14% dividend, ex-date: 20 Aug 26

stock-summary
SPLITS

Coastal Corporation Ltd has announced 2:10 stock split, ex-date: 04 Mar 25

stock-summary
BONUS

Coastal Corporation Ltd has announced 3:1 bonus issue, ex-date: 23 May 18

stock-summary
RIGHTS

Coastal Corporation Ltd has announced 1:6 rights issue, ex-date: 25 Aug 22

stock-summaryKey Factors

Quality key factors stock-summary

Factor
Value
Sales Growth (5y)
17.23%
EBIT Growth (5y)
18.14%
EBIT to Interest (avg)
1.15
Debt to EBITDA (avg)
11.18
Net Debt to Equity (avg)
1.45
Sales to Capital Employed (avg)
1.00
Tax Ratio
22.59%
Dividend Payout Ratio
32.88%
Pledged Shares
0
Institutional Holding
2.07%
ROCE (avg)
3.52%
ROE (avg)
4.43%

Valuation key factors

Factor
Value
P/E Ratio
8
Industry P/E
15
Price to Book Value
0.94
EV to EBIT
14.03
EV to EBITDA
10.37
EV to Capital Employed
0.97
EV to Sales
0.65
PEG Ratio
0.02
Dividend Yield
0.70%
ROCE (Latest)
6.43%
ROE (Latest)
9.31%

Technicals key factors

Indicator
Weekly
Monthly
MACD
Bearish
Bullish
RSI
No Signal
No Signal
Bollinger Bands
Bearish
Bearish
Moving Averages
Bearish (Daily)
KST
Bearish
Bullish
Dow Theory
Mildly Bearish
Mildly Bearish
OBV
No Trend
No Trend
stock-summary Technical Indicator Scale: Bearish, Mildly Bearish, Sideways, Mildly Bullish, Bullish  Turned 
stock-summaryShareholding
Shareholding Snapshot : Jun 2026stock-summary
Shareholding Compare (%holding) stock-summary
Majority shareholders

Non Institution

Pledged Promoter Holdings

None

Mutual Funds

Held by 0 Schemes

FIIs

Held by 6 FIIs (1.05%)

Promoter with highest holding

Thottoli Valsaraj (12.17%)

Highest Public shareholder

Pinakin Chimanlal Shah (2.56%)

Individual Investors Holdings

40.16%

stock-summaryFinancial
[
  {
    "link": "quarterly",
    "btn_text": "All Quarterly Results",
    "header": "Quarterly Results Snapshot (Consolidated) - Jun'26 - YoY",
    "rhs": [
      {
        "prefix": "Net Sales ",
        "suffix": "YoY Growth in quarter ended Jun 2026 is 38.23% vs 38.29% in Jun 2025",
        "dir": -1
      },
      {
        "prefix": "Consolidated Net Profit ",
        "suffix": "YoY Growth in quarter ended Jun 2026 is 100.87% vs 88.85% in Jun 2025",
        "dir": 1
      }
    ],
    "table": {
      "header": [
        "Jun'26",
        "Jun'25",
        "Change(%)"
      ],
      "body": [
        {
          "field": "Net Sales",
          "val1": "253.88",
          "val2": "183.66",
          "chgp": "38.23%",
          "chgp_class": "positive"
        },
        {
          "field": "Operating Profit (PBDIT) excl Other Income",
          "val1": "20.88",
          "val2": "16.09",
          "chgp": "29.77%",
          "chgp_class": "positive"
        },
        {
          "field": "Interest",
          "val1": "10.01",
          "val2": "6.42",
          "chgp": "55.92%",
          "chgp_class": "negative"
        },
        {
          "field": "Exceptional Items",
          "val1": "0.00",
          "val2": "0.00",
          "chgp": "",
          "chgp_class": "neutral"
        },
        {
          "field": "Consolidate Net Profit",
          "val1": "11.57",
          "val2": "5.76",
          "chgp": "100.87%",
          "chgp_class": "positive"
        },
        {
          "field": "Operating Profit Margin (Excl OI)",
          "val1": "8.22%",
          "val2": "8.76%",
          "chgp": "-0.54%",
          "chgp_class": "negative"
        }
      ]
    }
  },
  {
    "link": "half-yearly",
    "btn_text": "All Half Yearly Results",
    "header": "Half Yearly Results Snapshot (Consolidated) - Sep'25",
    "rhs": [
      {
        "prefix": "Net Sales ",
        "suffix": " Growth in half year ended Sep 2025 is 19.39% vs 35.69% in Sep 2024",
        "dir": -1
      },
      {
        "prefix": "Consolidated Net Profit ",
        "suffix": " Growth in half year ended Sep 2025 is 164.61% vs -54.18% in Sep 2024",
        "dir": 1
      }
    ],
    "table": {
      "header": [
        "Sep'25",
        "Sep'24",
        "Change(%)"
      ],
      "body": [
        {
          "field": "Net Sales",
          "val1": "343.34",
          "val2": "287.59",
          "chgp": "19.39%",
          "chgp_class": "positive"
        },
        {
          "field": "Operating Profit (PBDIT) excl Other Income",
          "val1": "27.22",
          "val2": "17.06",
          "chgp": "59.55%",
          "chgp_class": "positive"
        },
        {
          "field": "Interest",
          "val1": "13.49",
          "val2": "9.14",
          "chgp": "47.59%",
          "chgp_class": "negative"
        },
        {
          "field": "Exceptional Items",
          "val1": "0.00",
          "val2": "0.00",
          "chgp": "",
          "chgp_class": "neutral"
        },
        {
          "field": "Consolidate Net Profit",
          "val1": "9.42",
          "val2": "3.56",
          "chgp": "164.61%",
          "chgp_class": "positive"
        },
        {
          "field": "Operating Profit Margin (Excl OI)",
          "val1": "7.93%",
          "val2": "5.93%",
          "chgp": "2.00%",
          "chgp_class": "positive"
        }
      ]
    }
  },
  {
    "link": "nine-monthly",
    "btn_text": "All Nine Monthly Results",
    "header": "Nine Monthly Results Snapshot (Consolidated) - Dec'25",
    "rhs": [
      {
        "prefix": "Net Sales ",
        "suffix": "YoY Growth in nine months ended Dec 2025 is 37.11% vs 47.72% in Dec 2024",
        "dir": -1
      },
      {
        "prefix": "Consolidated Net Profit ",
        "suffix": "YoY Growth in nine months ended Dec 2025 is 199.64% vs -48.55% in Dec 2024",
        "dir": 1
      }
    ],
    "table": {
      "header": [
        "Dec'25",
        "Dec'24",
        "Change(%)"
      ],
      "body": [
        {
          "field": "Net Sales",
          "val1": "645.99",
          "val2": "471.14",
          "chgp": "37.11%",
          "chgp_class": "positive"
        },
        {
          "field": "Operating Profit (PBDIT) excl Other Income",
          "val1": "44.34",
          "val2": "26.04",
          "chgp": "70.28%",
          "chgp_class": "positive"
        },
        {
          "field": "Interest",
          "val1": "23.48",
          "val2": "16.07",
          "chgp": "46.11%",
          "chgp_class": "negative"
        },
        {
          "field": "Exceptional Items",
          "val1": "0.00",
          "val2": "0.00",
          "chgp": "",
          "chgp_class": "neutral"
        },
        {
          "field": "Consolidate Net Profit",
          "val1": "16.51",
          "val2": "5.51",
          "chgp": "199.64%",
          "chgp_class": "positive"
        },
        {
          "field": "Operating Profit Margin (Excl OI)",
          "val1": "6.86%",
          "val2": "5.53%",
          "chgp": "1.33%",
          "chgp_class": "positive"
        }
      ]
    }
  },
  {
    "link": "annual",
    "btn_text": "All Annual Results",
    "header": "Annual Results Snapshot (Consolidated) - Mar'26",
    "rhs": [
      {
        "prefix": "Net Sales ",
        "suffix": "YoY Growth in year ended Mar 2026 is 54.51% vs 44.23% in Mar 2025",
        "dir": 1
      },
      {
        "prefix": "Consolidated Net Profit ",
        "suffix": "YoY Growth in year ended Mar 2026 is 495.09% vs -0.88% in Mar 2025",
        "dir": 1
      }
    ],
    "table": {
      "header": [
        "Mar'26",
        "Mar'25",
        "Change(%)"
      ],
      "body": [
        {
          "field": "Net Sales",
          "val1": "970.66",
          "val2": "628.22",
          "chgp": "54.51%",
          "chgp_class": "positive"
        },
        {
          "field": "Operating Profit (PBDIT) excl Other Income",
          "val1": "60.49",
          "val2": "30.53",
          "chgp": "98.13%",
          "chgp_class": "positive"
        },
        {
          "field": "Interest",
          "val1": "34.43",
          "val2": "21.70",
          "chgp": "58.66%",
          "chgp_class": "negative"
        },
        {
          "field": "Exceptional Items",
          "val1": "0.00",
          "val2": "0.00",
          "chgp": "",
          "chgp_class": "neutral"
        },
        {
          "field": "Consolidate Net Profit",
          "val1": "26.66",
          "val2": "4.48",
          "chgp": "495.09%",
          "chgp_class": "positive"
        },
        {
          "field": "Operating Profit Margin (Excl OI)",
          "val1": "6.23%",
          "val2": "4.86%",
          "chgp": "1.37%",
          "chgp_class": "positive"
        }
      ]
    }
  }
]

Quarterly Results Snapshot (Consolidated) - Jun'26 - YoYstock-summary

Jun'26
Jun'25
Change(%)
Net Sales
253.88
183.66
38.23%
Operating Profit (PBDIT) excl Other Income
20.88
16.09
29.77%
Interest
10.01
6.42
55.92%
Exceptional Items
0.00
0.00
Consolidate Net Profit
11.57
5.76
100.87%
Operating Profit Margin (Excl OI)
8.22%
8.76%
-0.54%
Values in Rs Cr.
Direction Arrows
Net Sales

YoY Growth in quarter ended Jun 2026 is 38.23% vs 38.29% in Jun 2025

Direction Arrows
Consolidated Net Profit

YoY Growth in quarter ended Jun 2026 is 100.87% vs 88.85% in Jun 2025

Half Yearly Results Snapshot (Consolidated) - Sep'25stock-summary

Sep'25
Sep'24
Change(%)
Net Sales
343.34
287.59
19.39%
Operating Profit (PBDIT) excl Other Income
27.22
17.06
59.55%
Interest
13.49
9.14
47.59%
Exceptional Items
0.00
0.00
Consolidate Net Profit
9.42
3.56
164.61%
Operating Profit Margin (Excl OI)
7.93%
5.93%
2.00%
Values in Rs Cr.
Direction Arrows
Net Sales

Growth in half year ended Sep 2025 is 19.39% vs 35.69% in Sep 2024

Direction Arrows
Consolidated Net Profit

Growth in half year ended Sep 2025 is 164.61% vs -54.18% in Sep 2024

Nine Monthly Results Snapshot (Consolidated) - Dec'25stock-summary

Dec'25
Dec'24
Change(%)
Net Sales
645.99
471.14
37.11%
Operating Profit (PBDIT) excl Other Income
44.34
26.04
70.28%
Interest
23.48
16.07
46.11%
Exceptional Items
0.00
0.00
Consolidate Net Profit
16.51
5.51
199.64%
Operating Profit Margin (Excl OI)
6.86%
5.53%
1.33%
Values in Rs Cr.
Direction Arrows
Net Sales

YoY Growth in nine months ended Dec 2025 is 37.11% vs 47.72% in Dec 2024

Direction Arrows
Consolidated Net Profit

YoY Growth in nine months ended Dec 2025 is 199.64% vs -48.55% in Dec 2024

Annual Results Snapshot (Consolidated) - Mar'26stock-summary

Mar'26
Mar'25
Change(%)
Net Sales
970.66
628.22
54.51%
Operating Profit (PBDIT) excl Other Income
60.49
30.53
98.13%
Interest
34.43
21.70
58.66%
Exceptional Items
0.00
0.00
Consolidate Net Profit
26.66
4.48
495.09%
Operating Profit Margin (Excl OI)
6.23%
4.86%
1.37%
Values in Rs Cr.
Direction Arrows
Net Sales

YoY Growth in year ended Mar 2026 is 54.51% vs 44.23% in Mar 2025

Direction Arrows
Consolidated Net Profit

YoY Growth in year ended Mar 2026 is 495.09% vs -0.88% in Mar 2025

stock-summaryCompany CV
About Coastal Corporation Ltd stock-summary
stock-summary
Coastal Corporation Ltd
Micro Cap
FMCG
Coastal Corporation Limited (CCL) was originally established as Coastal Trawlers Private Limited in May, 1981. The Company converted into a Public limited company and the name of the Company was to Coastal Trawlers Limited in 1985 and further to Coastal Corporation Limited in 2005. Company is an Export-Oriented Unit (EOU) based in Visakhapatnam, India, specializing in shrimp processing and export The Company exports shrimps in different forms to quality conscious markets of U.S.
Company Coordinates stock-summary
Company Details
15-1-37/3 Nowroji Road, Jayaprada Apts Maharanipeta Visakhapatnam Andhra Pradesh : 530002
stock-summary
Tel: 91-891-2567118/2552556
stock-summary
coastal6@eth.net / cclinvestors@gma
Registrar Details
Bigshare Services Pvt Ltd , 306, Right Wing, Amrutha Ville, Opp. Yasodha Hospital, Raj Bhavan Road, Somajiguda, Hyderabad