
Compare Jay Shree Tea with Similar Stocks
Dashboard
With a Operating Losses, the company has a Weak Long Term Fundamental Strength
- Poor long term growth as Operating profit has grown by an annual rate -148.56% of over the last 5 years
- Low ability to service debt as the company has a high Debt to EBITDA ratio of 17.97 times
The company has declared Negative results for the last 3 consecutive quarters
Risky - Negative Operating Profits
Consistent Underperformance against the benchmark over the last 3 years
Stock DNA
FMCG
INR 247 Cr (Micro Cap)
NA (Loss Making)
65
0.58%
0.71
4.83%
0.58
Total Returns (Price + Dividend) 
Latest dividend: 0.5 per share ex-dividend date: Aug-05-2025
Risk Adjusted Returns v/s
Returns Beta

News
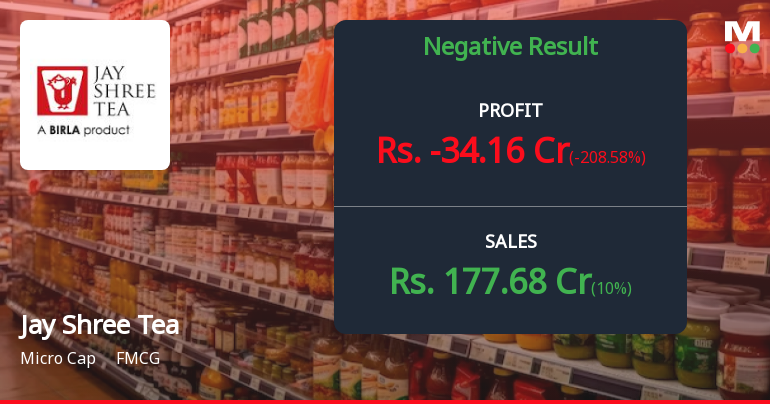
Jay Shree Tea Q4 FY26: Sharp Losses Deepen as Operational Challenges Mount
Jay Shree Tea & Industries Ltd. reported a consolidated net loss of ₹34.16 crores for Q4 FY26, marking a dramatic deterioration from the ₹31.46 crores profit recorded in Q4 FY25. The ₹247.00 crore market capitalisation company witnessed its quarterly performance collapse by 208.58% year-on-year, as operational losses widened and revenue contracted sharply on a sequential basis.
Read full news article
Jay Shree Tea & Industries Ltd is Rated Strong Sell
Jay Shree Tea & Industries Ltd is rated Strong Sell by MarketsMOJO. This rating was last updated on 03 Nov 2025, reflecting a significant reassessment of the stock’s outlook. However, the analysis and financial metrics presented here are based on the company’s current position as of 18 May 2026, providing investors with the latest insights into its performance and prospects.
Read full news article
Jay Shree Tea & Industries Ltd is Rated Strong Sell
Jay Shree Tea & Industries Ltd is rated Strong Sell by MarketsMOJO, with this rating last updated on 03 Nov 2025. However, the analysis and financial metrics discussed below reflect the company’s current position as of 07 May 2026, providing investors with an up-to-date view of its fundamentals, returns, and overall outlook.
Read full news article Announcements
Announcement Under Regulation 30-Voluntary Delisting From The Calcutta Stock Exchange
19-May-2026 | Source : BSEVoluntary Delisting of shares from the Calcutta Stock Exchange
Announcement under Regulation 30 (LODR)-Change in Management
19-May-2026 | Source : BSEAnnouncement under Regulation 30 regarding re-appointment of Whole Time Director and Independent Director subject to shareholders approval in ensuing Annual General meeting
Board Meeting Outcome for Outcome Of Board Meeting
19-May-2026 | Source : BSEOutcome of Board Meeting
Corporate Actions

No Upcoming Board Meetings

Jay Shree Tea & Industries Ltd has declared 10% dividend, ex-date: 05 Aug 25

Jay Shree Tea & Industries Ltd has announced 5:10 stock split, ex-date: 13 Aug 10

No Bonus history available

No Rights history available
Quality key factors
Valuation key factors
Technicals key factors
 Technical Indicator Scale: Bearish, Mildly Bearish, Sideways, Mildly Bullish, Bullish Turned
 Shareholding Snapshot : Mar 2026
Shareholding Compare (%holding)
Promoters
None
Held by 0 Schemes
Held by 2 FIIs (4.86%)
Jayashree Finvest Private Limited (23.09%)
Ares Diversified (4.85%)
36.88%
Quarterly Results Snapshot (Consolidated) - Mar'26 - YoY

YoY Growth in quarter ended Mar 2026 is 10.00% vs 20.34% in Mar 2025
YoY Growth in quarter ended Mar 2026 is -208.58% vs 309.31% in Mar 2025
Half Yearly Results Snapshot (Consolidated) - Sep'25
Growth in half year ended Sep 2025 is -0.99% vs 13.70% in Sep 2024
Growth in half year ended Sep 2025 is -50.61% vs -22.89% in Sep 2024
Nine Monthly Results Snapshot (Consolidated) - Dec'25
YoY Growth in nine months ended Dec 2025 is 8.01% vs 13.75% in Dec 2024
YoY Growth in nine months ended Dec 2025 is -90.43% vs 239.22% in Dec 2024
Annual Results Snapshot (Consolidated) - Mar'26
YoY Growth in year ended Mar 2026 is 8.39% vs 15.59% in Mar 2025
YoY Growth in year ended Mar 2026 is -119.81% vs 873.90% in Mar 2025
About Jay Shree Tea & Industries Ltd

Company Coordinates


