
Compare Indo National with Similar Stocks
Dashboard
With a Operating Losses, the company has a Weak Long Term Fundamental Strength
- Company's ability to service its debt is weak with a poor EBIT to Interest (avg) ratio of -4.12
- The company has been able to generate a Return on Equity (avg) of 7.13% signifying low profitability per unit of shareholders funds
The company has declared Negative results for the last 6 consecutive quarters
Risky - Negative EBITDA
Consistent Underperformance against the benchmark over the last 3 years
Stock DNA
FMCG
INR 249 Cr (Micro Cap)
NA (Loss Making)
30
1.48%
0.09
-8.71%
0.83
Total Returns (Price + Dividend) 
Latest dividend: 4.964330675618967 per share ex-dividend date: Sep-19-2025
Risk Adjusted Returns v/s
Returns Beta

News

Indo National Ltd is Rated Strong Sell
Indo National Ltd is rated Strong Sell by MarketsMOJO, with this rating last updated on 30 January 2025. However, the analysis and financial metrics discussed here reflect the company’s current position as of 14 July 2026, providing investors with an up-to-date view of its performance and outlook.
Read full news article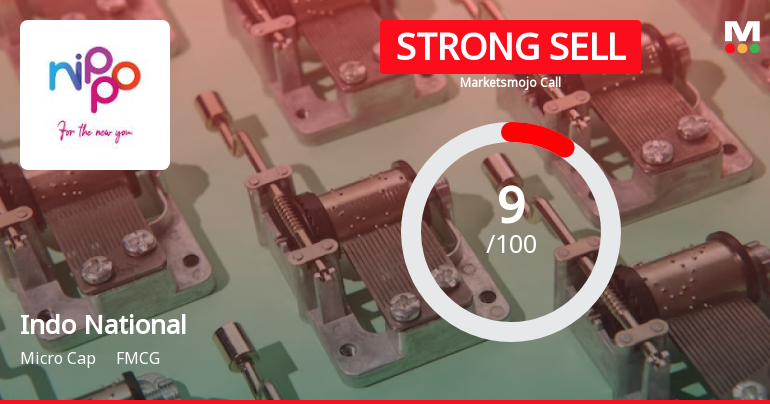
Indo National Ltd is Rated Strong Sell
Indo National Ltd is rated Strong Sell by MarketsMOJO, with this rating last updated on 30 Jan 2025. However, the analysis and financial metrics discussed here reflect the company’s current position as of 03 July 2026, providing investors with an up-to-date perspective on the stock’s fundamentals, valuation, financial trends, and technical outlook.
Read full news article
Indo National Ltd is Rated Strong Sell
Indo National Ltd is rated Strong Sell by MarketsMOJO, with this rating last updated on 30 January 2025. However, the analysis and financial metrics discussed here reflect the stock’s current position as of 22 June 2026, providing investors with an up-to-date view of the company’s fundamentals, valuation, financial trend, and technical outlook.
Read full news article Announcements
Announcement under Regulation 30 (LODR)-Updates on Acquisition
13-Jul-2026 | Source : BSEFurther investment in Medcuore Medical Solutions Private Limited
Compliances-Certificate under Reg. 74 (5) of SEBI (DP) Regulations 2018
07-Jul-2026 | Source : BSECompliance certificate under Regulation 74(5) of SEBI(DP) Regulation 2018 for quarter ended June 30 2026
Announcement under Regulation 30 (LODR)-Newspaper Publication
30-Jun-2026 | Source : BSENewspaper publication on transfer of unclaimed dividends and shares to IEPF
Corporate Actions

No Upcoming Board Meetings

Indo National Ltd has declared 100% dividend, ex-date: 19 Sep 25

Indo National Ltd has announced 5:10 stock split, ex-date: 28 Oct 21

No Bonus history available

No Rights history available
Quality key factors
Valuation key factors
Technicals key factors
 Technical Indicator Scale: Bearish, Mildly Bearish, Sideways, Mildly Bullish, Bullish Turned
 Shareholding Snapshot : Jun 2026
Shareholding Compare (%holding)
Promoters
None
Held by 0 Schemes
Held by 2 FIIs (0.0%)
Dwaraknath Reddy (44.1%)
Sharad Kanayalal Shah (4.24%)
29.24%
Quarterly Results Snapshot (Consolidated) - Mar'26 - YoY

YoY Growth in quarter ended Mar 2026 is 10.31% vs -42.51% in Mar 2025

YoY Growth in quarter ended Mar 2026 is -26,237.50% vs -96.67% in Mar 2025
Half Yearly Results Snapshot (Consolidated) - Sep'25
Growth in half year ended Sep 2025 is -3.89% vs -18.01% in Sep 2024
Growth in half year ended Sep 2025 is -98.41% vs 3,500.80% in Sep 2024
Nine Monthly Results Snapshot (Consolidated) - Dec'25
YoY Growth in nine months ended Dec 2025 is -6.75% vs -21.48% in Dec 2024
YoY Growth in nine months ended Dec 2025 is -104.59% vs 1,615.40% in Dec 2024
Annual Results Snapshot (Consolidated) - Mar'26
YoY Growth in year ended Mar 2026 is -3.21% vs -27.03% in Mar 2025
YoY Growth in year ended Mar 2026 is -121.28% vs 1,186.49% in Mar 2025
About Indo National Ltd

Company Coordinates


