
Compare Coffee Day Enter with Similar Stocks
Dashboard
Weak Long Term Fundamental Strength with an average Return on Capital Employed (ROCE) of 0.25%
- Poor long term growth as Net Sales has grown by an annual rate of 9.47% and Operating profit at 15.01% over the last 5 years
- Company's ability to service its debt is weak with a poor EBIT to Interest (avg) ratio of -1.22
Positive results in Mar 26
With ROCE of 0.2, it has a Very Attractive valuation with a 0.4 Enterprise value to Capital Employed
Falling Participation by Institutional Investors
Stock DNA
Leisure Services
INR 650 Cr (Micro Cap)
NA (Loss Making)
46
0.00%
0.29
-0.97%
0.23
Total Returns (Price + Dividend) 
Coffee Day Enter for the last several years.
Risk Adjusted Returns v/s
Returns Beta

News

Coffee Day Enterprises Ltd Upgraded to Hold by MarketsMOJO on Technical Improvements
Coffee Day Enterprises Ltd has seen its investment rating upgraded from Sell to Hold as of 30 July 2026, reflecting a notable improvement in its technical indicators and valuation metrics despite ongoing challenges in its financial trends and long-term fundamentals.
Read full news article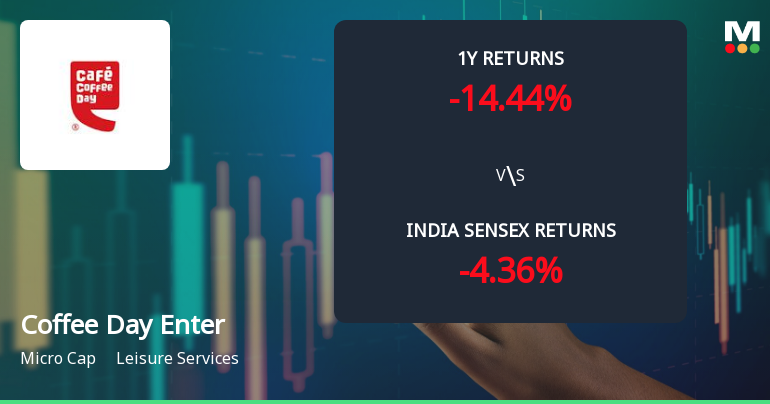
Coffee Day Enterprises Ltd Technical Momentum Shifts to Mildly Bullish
Coffee Day Enterprises Ltd, a micro-cap player in the Leisure Services sector, has recently exhibited a notable shift in its technical momentum, moving from a mildly bearish stance to a mildly bullish outlook. This change is underscored by mixed signals from key technical indicators such as MACD, RSI, Bollinger Bands, and moving averages, suggesting cautious optimism among traders and investors as the stock navigates a challenging market environment.
Read full news article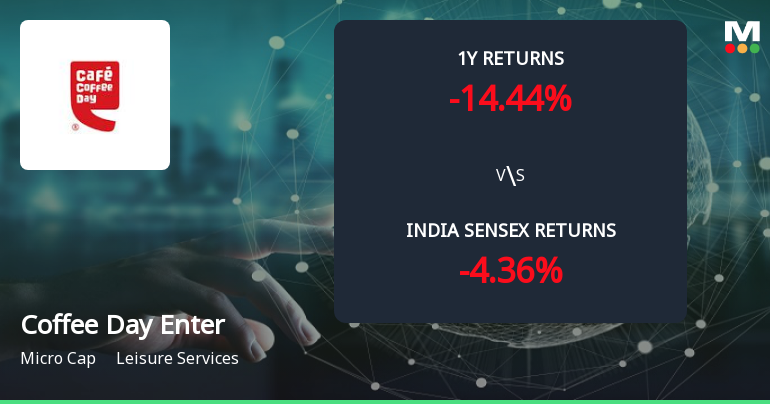
Coffee Day Enterprises Ltd Forms Golden Cross Amid Mixed Technical Signals
The 50-day moving average for Coffee Day Enterprises Ltd has crossed above the 200-day moving average, creating a golden cross on 30 Jul 2026. Yet, the broader technical and fundamental picture presents a nuanced view that tempers the enthusiasm such a crossover might typically inspire.
Read full news article Announcements
Coffee Day Enterprises Limited - Updates
27-Nov-2019 | Source : NSECoffee Day Enterprises Limited has informed the Exchange regarding 'Change in Directorate of Unlisted Material Subsidiary'.
Coffee Day Enterprises Limited - Shareholders meeting
21-Nov-2019 | Source : NSECoffee Day Enterprises Limited has informed the Exchange regarding Notice of Annual General Meeting to be held on December 14, 2019
Coffee Day Enterprises Limited - Resignation
13-Nov-2019 | Source : NSECoffee Day Enterprises Limited has informed the Exchange regarding Resignation of Mr Sanjay Nayar as Non- Executive Director of the company w.e.f. November 13, 2019.
Corporate Actions

06 Aug 2026

No Dividend history available

No Splits history available

No Bonus history available

No Rights history available
Quality key factors
Valuation key factors
Technicals key factors
 Technical Indicator Scale: Bearish, Mildly Bearish, Sideways, Mildly Bullish, Bullish Turned
 Shareholding Snapshot : Jun 2026
Shareholding Compare (%holding)
Non Institution
None
Held by 0 Schemes
Held by 9 FIIs (0.22%)
Ahih Resorts And Retreat Private Limited (4.28%)
Nls Mauritius Llc (4.76%)
70.81%
Quarterly Results Snapshot (Consolidated) - Mar'26 - YoY

YoY Growth in quarter ended Mar 2026 is 4.66% vs 6.93% in Mar 2025

YoY Growth in quarter ended Mar 2026 is 499.94% vs 89.09% in Mar 2025
Half Yearly Results Snapshot (Consolidated) - Sep'25
Growth in half year ended Sep 2025 is 3.67% vs 4.69% in Sep 2024
Growth in half year ended Sep 2025 is 206.65% vs 83.44% in Sep 2024
Nine Monthly Results Snapshot (Consolidated) - Dec'25
YoY Growth in nine months ended Dec 2025 is 3.14% vs 6.19% in Dec 2024
YoY Growth in nine months ended Dec 2025 is 383.85% vs -26.24% in Dec 2024
Annual Results Snapshot (Consolidated) - Mar'26
YoY Growth in year ended Mar 2026 is 3.52% vs 6.38% in Mar 2025
YoY Growth in year ended Mar 2026 is 449.84% vs 82.00% in Mar 2025
About Coffee Day Enterprises Ltd

Company Coordinates


