
Compare Coforge with Similar Stocks
Dashboard
Strong Long Term Fundamental Strength with an average Return on Equity (ROE) of 20.16%
- Healthy long term growth as Net Sales has grown by an annual rate of 28.53% and Operating profit at 30.18%
- Company has a Debt to Equity ratio (avg) of 0.03 times
With a growth in Net Profit of 124.54%, the company declared Very Positive results in Mar 26
With ROE of 17.7, it has a Very Expensive valuation with a 6.7 Price to Book Value
High Institutional Holdings at 67.37%
Stock DNA
Computers - Software & Consulting
INR 63,427 Cr (Mid Cap)
38.00
20
0.63%
-0.04
17.70%
6.69
Total Returns (Price + Dividend) 
Latest dividend: 3.990341080591609 per share ex-dividend date: Jan-30-2026
Risk Adjusted Returns v/s
Returns Beta

News
Coforge Ltd Sees Robust Trading Activity Amid Mid-Cap Market Rally
Coforge Ltd, a mid-cap player in the Computers - Software & Consulting sector, witnessed significant trading activity on 22 June 2026, with its shares outperforming the sector and broader market indices. Despite a recent downgrade in its Mojo Grade from Buy to Hold, the stock demonstrated resilience through strong value turnover and rising investor participation, signalling sustained interest from institutional and retail investors alike.
Read full news article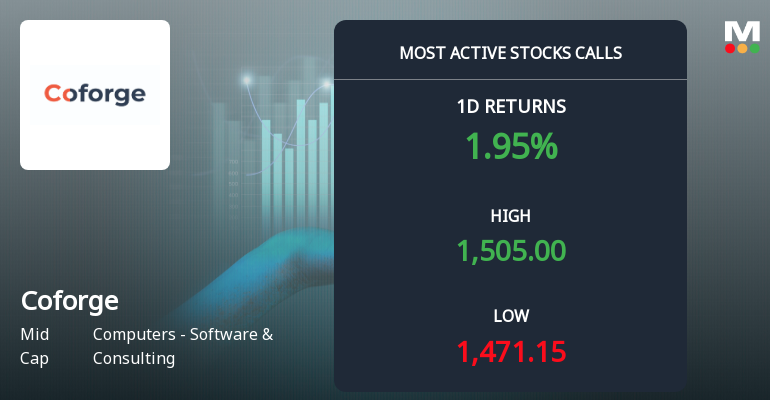
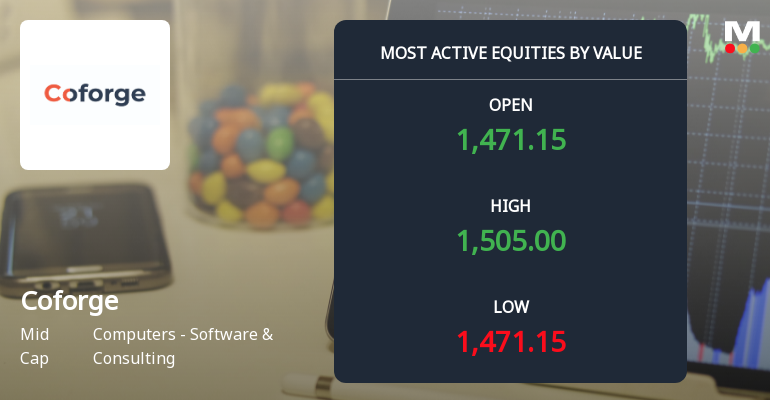
7,175 Call Contracts Traded on Coforge Ltd as Stock Edges Closer to Rs 1,500 Strike
On 22 Jun 2026, 7,175 call contracts on Coforge Ltd changed hands at the Rs 1,500 strike, with the stock closing near Rs 1,487.50. This synchrony between the options and cash markets highlights a focused directional interest as expiry approaches on 30 Jun 2026.
Read full news article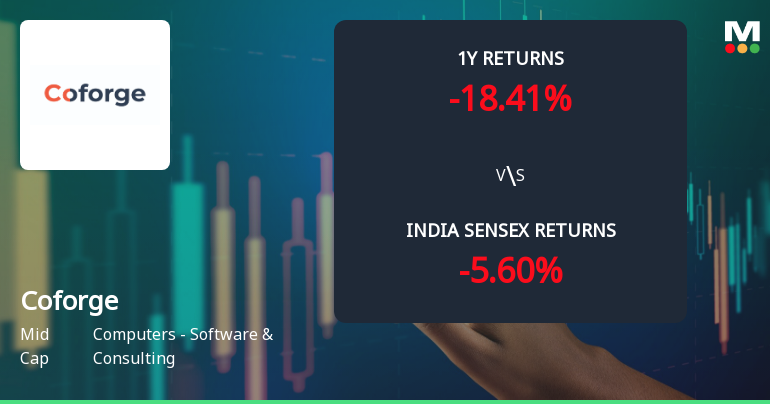
Coforge Ltd Technical Momentum Shifts Amid Mixed Indicator Signals
Coforge Ltd, a mid-cap player in the Computers - Software & Consulting sector, has experienced a notable shift in its technical momentum, moving from a mildly bearish stance to a more sideways trend. Despite a recent downgrade from a Buy to a Hold rating by MarketsMOJO on 6 February 2026, the stock continues to exhibit a complex interplay of bullish and bearish signals across key technical indicators, reflecting a nuanced market sentiment.
Read full news article Announcements
Intimation For Grant Of 940500 Equity Shares Under Employee Stock Option Plan 2005 (ESOP 2005)
17-Jun-2026 | Source : BSEIntimation for Grant of 940500 equity shares under Employee Stock Option Plan 2005 (ESOP 2005)
Announcement under Regulation 30 (LODR)-Analyst / Investor Meet - Outcome
16-Jun-2026 | Source : BSEIntimation of Investor Presentation of Investor Day 2026
Announcement under Regulation 30 (LODR)-Press Release / Media Release
09-Jun-2026 | Source : BSEPress Release Intimation
Corporate Actions

27 Jul 2026

Coforge Ltd has declared 200% dividend, ex-date: 30 Jan 26

Coforge Ltd has announced 2:10 stock split, ex-date: 04 Jun 25

Coforge Ltd has announced 1:2 bonus issue, ex-date: 30 Aug 07

No Rights history available
Quality key factors
Valuation key factors
Technicals key factors
 Technical Indicator Scale: Bearish, Mildly Bearish, Sideways, Mildly Bullish, Bullish Turned
 Shareholding Snapshot : Jun 2026
Shareholding Compare (%holding)
Non Institution
None
Held by 47 Schemes (29.78%)
Held by 444 FIIs (24.66%)
None
Ai Altius Parent (cayman) Limited (12.85%)
8.34%
Quarterly Results Snapshot (Consolidated) - Mar'26 - QoQ

QoQ Growth in quarter ended Mar 2026 is 5.18% vs 6.17% in Dec 2025

QoQ Growth in quarter ended Mar 2026 is 144.72% vs -33.42% in Dec 2025
Half Yearly Results Snapshot (Consolidated) - Sep'25
Growth in half year ended Sep 2025 is 42.57% vs 19.69% in Sep 2024
Growth in half year ended Sep 2025 is 106.74% vs -3.18% in Sep 2024
Nine Monthly Results Snapshot (Consolidated) - Dec'25
YoY Growth in nine months ended Dec 2025 is 37.79% vs 26.69% in Dec 2024
YoY Growth in nine months ended Dec 2025 is 71.28% vs -5.73% in Dec 2024
Annual Results Snapshot (Consolidated) - Mar'26
YoY Growth in year ended Mar 2026 is 35.86% vs 34.02% in Mar 2025
YoY Growth in year ended Mar 2026 is 91.57% vs 0.51% in Mar 2025
About Coforge Ltd

Company Coordinates


