Commerl. Synbags

INR
281.00
-7.1 (-2.46%)
BSENSE

Aug 17, 12:18 PM

BSE+NSE Vol: 1.7 lacs

  • Price Points
  • Score
  • Mojo Parameters
  • Total Return
  • News and Corporate Actions
  • Key factors
  • Shareholding
  • Financials
  • CompanyCV
stock-summaryPrice Point
High/Low

1Day

52 Week

Valuation
Technical
Day's Volume

CASH

1.7 lacs (-90.19%) Volume

Shareholding (Jun 2026)

FII

0.00%

Held by 0 FIIs

DII

0.06%

Held by 0 DIIs

Promoter

59.18%

Why is Commercial Syn Bags Ltd falling/rising?

17-Aug-2026

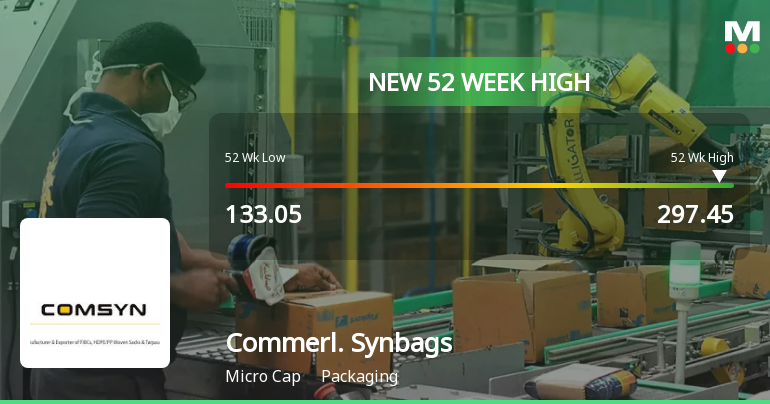
As of 16-Aug, the stock price of Commercial Syn Bags Ltd is rising to Rs. 288.50, supported by a recent 52-week high and a year-to-date increase of 99.72%. Despite a decline in investor participation, the stock shows strong performance and bullish signals from moving averages.

As of 16-Aug, the stock price of Commercial Syn Bags Ltd is rising, currently at Rs. 288.50, reflecting an increase of Rs. 4.85 or 1.71%. This upward movement is supported by several factors. The stock has recently achieved a new 52-week high of Rs. 289.8 today, indicating strong performance. Over the past three days, the stock has gained 7.55%, demonstrating consistent positive momentum. Additionally, it has outperformed the sector by 2.6% today, further contributing to its rising price.<BR><BR>The stock's performance over various periods also highlights its strength, with a year-to-date increase of 99.72% and a one-year increase of 104.25%, significantly outperforming the Sensex, which has seen a decline of 8.46% and 3.21% respectively in the same time frames. Furthermore, the stock is trading above its 5-day, 20-day, 50-day, 100-day, and 200-day moving averages, which is typically a bullish signal.<BR><BR>However, it is worth noting that there has been a decline in investor participation, with delivery volume falling by 69.74% against the 5-day average. Despite this, the stock remains liquid enough for trading, indicating that the price rise is supported by sufficient market activity. Overall, the combination of strong recent gains, significant year-to-date performance, and the achievement of a new high are key reasons for the rising stock price of Commercial Syn Bags Ltd.

View full answer

Who are in the management team of Commerl. Synbags?

14-Aug-2026

The management team of Commerl. Synbags includes Anil Choudhary (Chairman & Managing Director), Ranjana Choudhary and Virendra Singh Pamecha (Whole Time Directors), along with Hitesh Mehta, Milind Mahajan, and Chintan Singhvi (Non-Executive Independent Directors), and Anamika Gupta (Company Secretary & Compliance Officer). They oversee the company's operations and strategic direction.

The management team of Commerl. Synbags includes the following key individuals:<BR><BR>1. **Anil Choudhary** - Chairman & Managing Director<BR>2. **Ranjana Choudhary** - Whole Time Director<BR>3. **Virendra Singh Pamecha** - Whole Time Director<BR>4. **Hitesh Mehta** - Non Executive Independent Director<BR>5. **Milind Mahajan** - Non Executive Independent Director<BR>6. **Chintan Singhvi** - Non Executive Independent Director<BR>7. **Anamika Gupta** - Company Secretary & Compliance Officer<BR><BR>This team is responsible for overseeing the company's operations and strategic direction.

View full answer

What does Commerl. Synbags do?

14-Aug-2026

Commercial Syn Bags Ltd is a micro-cap manufacturer and exporter of packaging products, with net sales of 109 Cr and a net profit of 9 Cr as of June 2026. The company has a market cap of INR 1,088 Cr and key financial metrics include a P/E of 39.00 and a dividend yield of 0.15%.

Overview: <BR>Commercial Syn Bags Ltd is a manufacturer and exporter of various packaging products, operating within the micro-cap segment of the packaging industry.<BR><BR>History: <BR>Commercial Syn Bags Ltd was incorporated on 10 December, 1984. The latest quarterly results reported net sales and profit for the period ending June 2026.<BR><BR>Financial Snapshot: <BR>Net Sales: 109 Cr (Quarterly Results - Jun 2026) <BR>Net Profit: 9 Cr (Quarterly Results - Jun 2026) <BR>Market Cap: INR 1,088 Cr (Micro Cap)<BR><BR>Key Metrics: <BR>P/E: 39.00 <BR>Industry P/E: 33 <BR>Dividend Yield: 0.15% <BR>Debt-Equity: 0.69 <BR>Return on Equity: 14.82% <BR>Price to Book: 6.11<BR><BR>Contact Details: <BR>Address: Commercial House, 3-4 Jaora Compound M Y H Road Indore Madhya Pradesh : 452001 <BR>Tel: 91-731-4279525/26 <BR>Email: investors@comsyn.com <BR>Website: http://www.comsyn.com

View full answer

Who are the peers of the Commerl. Synbags?

14-Aug-2026

Commerl. Synbags' peers include Cosmo First, Mold-Tek Pack, Huhtamaki India, Arrow Greentech, Ester Industries, Oricon Enterpris, Haldyn Glass, Nahar Poly, and Pyramid Technopl. Commerl. Synbags leads in 1-year returns at 108.26%, significantly outperforming its peers, while Ester Industries has the lowest return at -4.99%.

Peers: The peers of Commerl. Synbags are Cosmo First, Mold-Tek Pack., Huhtamaki India, Arrow Greentech, Ester Industries, Oricon Enterpris, Haldyn Glass, Nahar Poly, and Pyramid Technopl.<BR><BR>Quality Snapshot: Excellent management risk is observed at Mold-Tek Pack., while Average management risk is found at Cosmo First, Huhtamaki India, Arrow Greentech, Haldyn Glass, Nahar Poly, Oricon Enterpris, and the rest. Below Average management risk is seen at Ester Industries. In terms of Growth, Excellent growth is noted at Arrow Greentech, while Below Average growth is found at Cosmo First, Mold-Tek Pack., Huhtamaki India, Ester Industries, Oricon Enterpris, Haldyn Glass, Nahar Poly, and the rest. Average capital structure is observed at Mold-Tek Pack., Huhtamaki India, Arrow Greentech, Haldyn Glass, Nahar Poly, and the rest, while Excellent capital structure is noted at Mold-Tek Pack. and Pyramid Technopl, and Below Average capital structure is seen at Ester Industries, Oricon Enterpris, and Commerl. Synbags.<BR><BR>Return Snapshot: The peer with the highest 1-year return is Commerl. Synbags at 108.26%, while the peer with the lowest is Ester Industries at -4.99%. Commerl. Synbags' return significantly outperforms all peers. Additionally, Oricon Enterpris and Nahar Poly have negative six-month returns.

View full answer

How big is Commerl. Synbags?

14-Aug-2026

As of 14th August, Commercial Syn Bags Ltd has a market capitalization of 1,161.97 Cr and reported net sales of 405.62 Cr and net profit of 29.69 Cr over the latest four quarters.

As of 14th August, <BR><BR>Market Cap: Commercial Syn Bags Ltd has a market capitalization of 1,161.97 Cr, classified as a Micro Cap.<BR><BR>Recent Quarterly Performance: The sum of Net Sales for the latest 4 quarters is 405.62 Cr, while the sum of Net Profit for the same period is 29.69 Cr.<BR><BR>Balance Sheet Snapshot: The reporting period for the latest annual data is March 2025. Shareholder's Funds are valued at 150.05 Cr, and Total Assets amount to 307.68 Cr.

View full answer

Should I buy, sell or hold Commercial Syn Bags Ltd?

09-Aug-2026

When is the next results date for Commercial Syn Bags Ltd?

06-Aug-2026

The next results date for Commercial Syn Bags Ltd is August 8, 2026.

The next results date for Commercial Syn Bags Ltd is scheduled for August 8, 2026.

View full answer

Are Commercial Syn Bags Ltd latest results good or bad?

01-Jun-2026

Commercial Syn Bags Ltd's latest results show strong revenue growth, with a record ₹100.56 crores in Q4 FY26, but a significant year-on-year decline in net profit by 21.44% raises concerns about profitability and operational efficiency. Overall, the results are mixed, indicating financial strain despite positive revenue trends.

The latest results for Commercial Syn Bags Ltd present a mixed picture. On one hand, the company achieved its highest-ever quarterly revenue of ₹100.56 crores in Q4 FY26, reflecting a sequential growth of 3.16% and a year-on-year increase of 2.83%. This indicates that the company is maintaining demand for its products in a competitive market.<BR><BR>However, the net profit for the same quarter was ₹6.34 crores, which represents a significant decline of 21.44% year-on-year, despite a sequential increase of 5.67%. This sharp drop in profit, coupled with a contraction in the PAT margin to 6.30%, highlights ongoing challenges in maintaining profitability amid rising operational costs, particularly employee expenses and depreciation.<BR><BR>Overall, while the revenue growth is a positive sign, the substantial decline in net profit and margin pressures suggest that the company's financial health is under strain. Therefore, the results can be viewed as concerning, particularly for investors focused on profitability and operational efficiency.

View full answer

Is Commerl. Synbags overvalued or undervalued?

02-Dec-2025

As of December 1, 2025, Commerl. Synbags is considered undervalued with an attractive valuation grade, a PE Ratio of 21.88, and strong growth potential, significantly outperforming peers and the Sensex over the past year.

As of 1 December 2025, the valuation grade for Commerl. Synbags has moved from fair to attractive, indicating a more favorable assessment of its value. The company is currently considered undervalued. Key ratios include a PE Ratio of 21.88, an EV to EBITDA of 14.78, and a PEG Ratio of 0.11, which suggests strong growth potential relative to its price.<BR><BR>In comparison to peers, Commerl. Synbags stands out with a significantly lower PE Ratio than Supreme Inds. at 49.97 and Astral at 75.87, both of which are classified as very expensive. Additionally, while Finolex Inds. is rated fair with a PE of 22.79, Commerl. Synbags' attractive valuation indicates it is positioned favorably within its industry. Notably, the company's stock has outperformed the Sensex over the past year, with a return of 95.31% compared to the Sensex's 7.32%, reinforcing its undervalued status.

View full answer

Is Commerl. Synbags technically bullish or bearish?

11-Nov-2025

As of November 10, 2025, Commerl. Synbags shows a mildly bullish trend, supported by daily moving averages and Bollinger Bands, despite some mixed signals from weekly MACD and monthly RSI.

As of 10 November 2025, the technical trend for Commerl. Synbags has changed from bullish to mildly bullish. The current stance is mildly bullish, supported by the daily moving averages indicating mild bullishness and the Bollinger Bands showing a mildly bullish trend on both weekly and monthly time frames. However, the weekly MACD and KST are mildly bearish, and the monthly RSI is bearish, which introduces some caution. The Dow Theory remains bullish on both weekly and monthly time frames, providing a positive outlook. Overall, while there are mixed signals, the prevailing trend is mildly bullish.

View full answer

How has been the historical performance of Commerl. Synbags?

09-Nov-2025

Commerl. Synbags has shown steady growth in net sales and profitability from Mar'20 to Mar'25, with net sales increasing from 190.97 Cr to 347.82 Cr and profit after tax rising from 11.42 Cr to 17.12 Cr, despite fluctuations in certain financial metrics. Total assets and liabilities both grew significantly during this period, while cash flow from operating activities decreased.

Answer:<BR>The historical performance of Commerl. Synbags shows a steady growth in net sales and profitability over the years, with significant fluctuations in various financial metrics.<BR><BR>Breakdown:<BR>Commerl. Synbags has demonstrated an upward trend in net sales, increasing from 190.97 Cr in Mar'20 to 347.82 Cr in Mar'25. Total operating income followed a similar trajectory, reaching 347.82 Cr in Mar'25, up from 190.97 Cr in Mar'20. The company's total expenditure, excluding depreciation, also rose from 167.21 Cr in Mar'20 to 312.25 Cr in Mar'25, reflecting increased operational costs. Operating profit, excluding other income, improved from 23.76 Cr in Mar'20 to 35.57 Cr in Mar'25, while the overall operating profit (PBDIT) increased to 39.60 Cr in Mar'25 from 25.62 Cr in Mar'20. Profit before tax showed a notable increase to 21.41 Cr in Mar'25 from 14.44 Cr in Mar'20, leading to a profit after tax of 17.12 Cr in Mar'25, compared to 11.42 Cr in Mar'20. The company's earnings per share (EPS) rose to 4.29 in Mar'25 from 9.66 in Mar'20, indicating fluctuations in profitability per share. Total assets grew significantly from 139.99 Cr in Mar'20 to 307.68 Cr in Mar'25, while total liabilities also increased from 139.99 Cr to 307.68 Cr during the same period. Cash flow from operating activities fluctuated, with a cash inflow of 1.00 Cr in Mar'25, down from 27.00 Cr in Mar'20. Overall, Commerl. Synbags has shown resilience and growth in its financial performance despite some volatility in specific areas.

View full answer

Who are the top shareholders of the Commerl. Synbags?

17-Jul-2025

The top shareholders of Commerl. Synbags include Super Sack Private Limited with 26.55%, Praavanya Ventures LLP at 5.07%, and individual investors holding 26.63%. There are no mutual funds or foreign institutional investors involved.

The top shareholders of Commerl. Synbags are primarily its promoters. The largest promoter is Super Sack Private Limited, which holds 26.55% of the shares. Additionally, the highest public shareholder is Praavanya Ventures LLP, with a stake of 5.07%. Individual investors collectively hold 26.63% of the company's shares. There are no mutual funds or foreign institutional investors currently holding shares in the company.

View full answer

What is the bonus history of the Commerl. Synbags?

06-Jun-2025

Commerl. Synbags announced a 2:1 bonus issue on November 25, 2022, granting shareholders two additional shares for every one share held. This date also served as the ex-date for the bonus.

The bonus history of Commerl. Synbags includes a notable event where the company announced a 2:1 bonus issue. This was recorded on November 25, 2022, which was also the ex-date for this bonus. In this ratio, shareholders received two additional shares for every one share they held. If you have any more questions about the company or its financial activities, feel free to ask!

View full answer

Has Commerl. Synbags declared dividend?

06-Jun-2025

Yes, Commercial Syn Bags Ltd has declared a 21% dividend, amounting to ₹2.1 per share, but the dividend yield is 0%. The company has demonstrated strong price returns, with a total return of 701.34% over the last 5 years.

Commercial Syn Bags Ltd has declared a 21% dividend.<BR><BR>Dividend Details:<BR>- Percentage announced: 21%<BR>- Amount per share: 2.1<BR>- Ex-date: 22 Sep 22<BR><BR>Dividend Yield: 0%<BR><BR>Total Returns by Period:<BR>In the last 6 months, the price return was 77.42%, the dividend return was 0%, resulting in a total return of 77.42%.<BR><BR>Over the past year, the price return was 94.17%, with a dividend return of 0%, leading to a total return of 94.17%.<BR><BR>In the 2-year period, the price return was 73.15%, the dividend return was 0%, giving a total return of 73.15%.<BR><BR>For the 3-year period, the price return was 43.8%, the dividend return was 2.65%, resulting in a total return of 46.45%.<BR><BR>In the 4-year period, the price return was 238.12%, the dividend return was 8.72%, leading to a total return of 246.84%.<BR><BR>Over the last 5 years, the price return was 668.22%, with a dividend return of 33.12%, resulting in a total return of 701.34%.<BR><BR>Overall, while Commercial Syn Bags Ltd has declared a dividend, the dividend yield remains at 0%. The company has shown strong price returns across all periods, indicating significant growth, particularly over the longer term.

View full answer
iScoreScore
Click here to find our call on this stock
Strong Sell
Sell
Hold
Buy
Strong Buy

Dashboard

1

Low ability to service debt as the company has a high Debt to EBITDA ratio of 2.68 times

  • Low ability to service debt as the company has a high Debt to EBITDA ratio of 2.68 times
2

Poor long term growth as Net Sales has grown by an annual rate of 9.81% and Operating profit at 15.89% over the last 5 years

 
3

Positive results in Jun 26

4

With ROCE of 12.4, it has a Expensive valuation with a 4.3 Enterprise value to Capital Employed

5

Despite the size of the company, domestic mutual funds hold only 0% of the company

stock-summaryMojo Parameters

Mojo Parameters

Loading Valuation Snapshot...

Stock DNA

stock-summary
Industry

Packaging

stock-summary
Market cap

INR 1,134 Cr (Micro Cap)

stock-summary
P/E

39.00

stock-summary
Industry P/E

34

stock-summary
Dividend Yield

0.14%

stock-summary
Debt Equity

0.69

stock-summary
Return on Equity

14.82%

stock-summary
Price to Book

6.56

Revenue and Profits:
Net Sales:
109 Cr
(Quarterly Results - Jun 2026)
Net Profit:
9 Cr
stock-summaryTotal Returns
Total Returns (Price + Dividend) stock-summary
Dividend Yield (0.14%)
TimePeriod
Price Return
Dividend Return
Total Return
3 Months
83.66%
0%
83.66%
6 Months
48.25%
0%
48.25%
1 Year
98.94%
0.29%
99.23%
2 Years
332.44%
0.60%
333.04%
3 Years
375.79%
0.64%
376.43%
4 Years
193.69%
1.23%
194.92%
5 Years
532.6%
3.72%
536.32%

Latest dividend: 0.4 per share ex-dividend date: Sep-22-2025

Risk Adjusted Returns v/s stock-summary
Returns Beta
Icon
Beta has not been calculated since enough price history is not available
stock-summaryNews & Corporate Actions

News

Commercial Syn Bags Ltd Surges 28.07% in a Week: 5 Key Drivers Behind the Rally

Announcements stock-summary

Announcement under Regulation 30 (LODR)-Newspaper Publication

10-Aug-2026 | Source : BSE

We are please to submit the copy of extract of Newspaper.

Standalone And Consolidated Un-Audited Financial Results Along With Limited Review Report Thereon For The Quarter Ended On 30Th June 2026

08-Aug-2026 | Source : BSE

We are pleased to submit Standalone and Consolidated Un-audited Financial Results for quarter ended on 30th June 2026.

Board Meeting Outcome for Submission Of The Outcome Of 2/2026-27 Board Meeting Along With Standalone And Consolidated Un-Audited Financial Results Along With Limited Review Report Thereon For The Quarter Ended On 30Th June 2026

08-Aug-2026 | Source : BSE

Pursuant to Regulation 30 and 33 of SEBI (LODR) Regulations 2015 we are pleased to submit Standalone and Consolidated Unaudited Financial Results for the Quarter ended 30th June 2026 along with Limited Review Report by the Statutory Auditors for the quarter ended 30th June 2026 in PDF Format which were also approved by the Audit Committee and Board of Directors at their meeting held on Saturday 8th August 2026.

Corporate Actions stock-summary

stock-summary
BOARD MEETING

No Upcoming Board Meetings

stock-summary
DIVIDEND

Commercial Syn Bags Ltd has declared 4% dividend, ex-date: 22 Sep 25

stock-summary
SPLITS

No Splits history available

stock-summary
BONUS

Commercial Syn Bags Ltd has announced 2:1 bonus issue, ex-date: 25 Nov 22

stock-summary
RIGHTS

No Rights history available

stock-summaryKey Factors

Quality key factors stock-summary

Factor
Value
Sales Growth (5y)
9.81%
EBIT Growth (5y)
15.89%
EBIT to Interest (avg)
3.09
Debt to EBITDA (avg)
3.24
Net Debt to Equity (avg)
0.69
Sales to Capital Employed (avg)
1.39
Tax Ratio
16.53%
Dividend Payout Ratio
9.33%
Pledged Shares
0
Institutional Holding
0.06%
ROCE (avg)
9.97%
ROE (avg)
11.27%

Valuation key factors

Factor
Value
P/E Ratio
39
Industry P/E
34
Price to Book Value
6.56
EV to EBIT
30.97
EV to EBITDA
24.42
EV to Capital Employed
4.28
EV to Sales
3.17
PEG Ratio
0.94
Dividend Yield
0.14%
ROCE (Latest)
12.37%
ROE (Latest)
14.82%

Technicals key factors

Indicator
Weekly
Monthly
MACD
Bullish
Bullish
RSI
Bearish
Bearish
Bollinger Bands
Bullish
Bullish
Moving Averages
Bullish (Daily)
KST
Bullish
Bullish
Dow Theory
Bullish
Bullish
OBV
Bullish
Bullish
stock-summary Technical Indicator Scale: Bearish, Mildly Bearish, Sideways, Mildly Bullish, Bullish  Turned 
stock-summaryShareholding
Shareholding Snapshot : Jun 2026stock-summary
Shareholding Compare (%holding) stock-summary
Majority shareholders

Promoters

Pledged Promoter Holdings

None

Mutual Funds

Held by 0 Schemes

FIIs

Held by 0 FIIs

Promoter with highest holding

Super Sack Private Limited (26.29%)

Highest Public shareholder

Praavanya Ventures Llp (5.39%)

Individual Investors Holdings

22.05%

stock-summaryFinancial
[
  {
    "link": "quarterly",
    "btn_text": "All Quarterly Results",
    "header": "Quarterly Results Snapshot (Consolidated) - Jun'26 - YoY",
    "rhs": [
      {
        "prefix": "Net Sales ",
        "suffix": "YoY Growth in quarter ended Jun 2026 is 20.57% vs 17.71% in Jun 2025",
        "dir": 1
      },
      {
        "prefix": "Consolidated Net Profit ",
        "suffix": "YoY Growth in quarter ended Jun 2026 is 60.90% vs 187.56% in Jun 2025",
        "dir": -1
      }
    ],
    "table": {
      "header": [
        "Jun'26",
        "Jun'25",
        "Change(%)"
      ],
      "body": [
        {
          "field": "Net Sales",
          "val1": "109.13",
          "val2": "90.51",
          "chgp": "20.57%",
          "chgp_class": "positive"
        },
        {
          "field": "Operating Profit (PBDIT) excl Other Income",
          "val1": "15.69",
          "val2": "11.02",
          "chgp": "42.38%",
          "chgp_class": "positive"
        },
        {
          "field": "Interest",
          "val1": "1.99",
          "val2": "2.44",
          "chgp": "-18.44%",
          "chgp_class": "positive"
        },
        {
          "field": "Exceptional Items",
          "val1": "0.00",
          "val2": "0.00",
          "chgp": "",
          "chgp_class": "neutral"
        },
        {
          "field": "Consolidate Net Profit",
          "val1": "8.93",
          "val2": "5.55",
          "chgp": "60.90%",
          "chgp_class": "positive"
        },
        {
          "field": "Operating Profit Margin (Excl OI)",
          "val1": "14.38%",
          "val2": "12.18%",
          "chgp": "2.20%",
          "chgp_class": "positive"
        }
      ]
    }
  },
  {
    "link": "half-yearly",
    "btn_text": "All Half Yearly Results",
    "header": "Half Yearly Results Snapshot (Consolidated) - Sep'25",
    "rhs": [
      {
        "prefix": "Net Sales ",
        "suffix": " Growth in half year ended Sep 2025 is 15.55% vs 10.69% in Sep 2024",
        "dir": 1
      },
      {
        "prefix": "Consolidated Net Profit ",
        "suffix": " Growth in half year ended Sep 2025 is 152.80% vs 13.09% in Sep 2024",
        "dir": 1
      }
    ],
    "table": {
      "header": [
        "Sep'25",
        "Sep'24",
        "Change(%)"
      ],
      "body": [
        {
          "field": "Net Sales",
          "val1": "188.97",
          "val2": "163.54",
          "chgp": "15.55%",
          "chgp_class": "positive"
        },
        {
          "field": "Operating Profit (PBDIT) excl Other Income",
          "val1": "24.02",
          "val2": "14.73",
          "chgp": "63.07%",
          "chgp_class": "positive"
        },
        {
          "field": "Interest",
          "val1": "4.53",
          "val2": "4.42",
          "chgp": "2.49%",
          "chgp_class": "negative"
        },
        {
          "field": "Exceptional Items",
          "val1": "0.00",
          "val2": "0.00",
          "chgp": "",
          "chgp_class": "neutral"
        },
        {
          "field": "Consolidate Net Profit",
          "val1": "13.98",
          "val2": "5.53",
          "chgp": "152.80%",
          "chgp_class": "positive"
        },
        {
          "field": "Operating Profit Margin (Excl OI)",
          "val1": "12.71%",
          "val2": "9.01%",
          "chgp": "3.70%",
          "chgp_class": "positive"
        }
      ]
    }
  },
  {
    "link": "nine-monthly",
    "btn_text": "All Nine Monthly Results",
    "header": "Nine Monthly Results Snapshot (Consolidated) - Dec'25",
    "rhs": [
      {
        "prefix": "Net Sales ",
        "suffix": "YoY Growth in nine months ended Dec 2025 is 14.57% vs 14.27% in Dec 2024",
        "dir": 1
      },
      {
        "prefix": "Consolidated Net Profit ",
        "suffix": "YoY Growth in nine months ended Dec 2025 is 120.77% vs 95.04% in Dec 2024",
        "dir": 1
      }
    ],
    "table": {
      "header": [
        "Dec'25",
        "Dec'24",
        "Change(%)"
      ],
      "body": [
        {
          "field": "Net Sales",
          "val1": "286.45",
          "val2": "250.03",
          "chgp": "14.57%",
          "chgp_class": "positive"
        },
        {
          "field": "Operating Profit (PBDIT) excl Other Income",
          "val1": "36.11",
          "val2": "24.17",
          "chgp": "49.40%",
          "chgp_class": "positive"
        },
        {
          "field": "Interest",
          "val1": "6.69",
          "val2": "7.16",
          "chgp": "-6.56%",
          "chgp_class": "positive"
        },
        {
          "field": "Exceptional Items",
          "val1": "0.00",
          "val2": "0.00",
          "chgp": "",
          "chgp_class": "neutral"
        },
        {
          "field": "Consolidate Net Profit",
          "val1": "19.98",
          "val2": "9.05",
          "chgp": "120.77%",
          "chgp_class": "positive"
        },
        {
          "field": "Operating Profit Margin (Excl OI)",
          "val1": "12.61%",
          "val2": "9.67%",
          "chgp": "2.94%",
          "chgp_class": "positive"
        }
      ]
    }
  },
  {
    "link": "annual",
    "btn_text": "All Annual Results",
    "header": "Annual Results Snapshot (Consolidated) - Mar'26",
    "rhs": [
      {
        "prefix": "Net Sales ",
        "suffix": "YoY Growth in year ended Mar 2026 is 11.26% vs 20.59% in Mar 2025",
        "dir": -1
      },
      {
        "prefix": "Consolidated Net Profit ",
        "suffix": "YoY Growth in year ended Mar 2026 is 53.74% vs 117.81% in Mar 2025",
        "dir": -1
      }
    ],
    "table": {
      "header": [
        "Mar'26",
        "Mar'25",
        "Change(%)"
      ],
      "body": [
        {
          "field": "Net Sales",
          "val1": "387.00",
          "val2": "347.82",
          "chgp": "11.26%",
          "chgp_class": "positive"
        },
        {
          "field": "Operating Profit (PBDIT) excl Other Income",
          "val1": "48.00",
          "val2": "35.57",
          "chgp": "34.95%",
          "chgp_class": "positive"
        },
        {
          "field": "Interest",
          "val1": "9.12",
          "val2": "9.36",
          "chgp": "-2.56%",
          "chgp_class": "positive"
        },
        {
          "field": "Exceptional Items",
          "val1": "0.00",
          "val2": "0.00",
          "chgp": "",
          "chgp_class": "neutral"
        },
        {
          "field": "Consolidate Net Profit",
          "val1": "26.32",
          "val2": "17.12",
          "chgp": "53.74%",
          "chgp_class": "positive"
        },
        {
          "field": "Operating Profit Margin (Excl OI)",
          "val1": "12.40%",
          "val2": "10.23%",
          "chgp": "2.17%",
          "chgp_class": "positive"
        }
      ]
    }
  }
]

Quarterly Results Snapshot (Consolidated) - Jun'26 - YoYstock-summary

Jun'26
Jun'25
Change(%)
Net Sales
109.13
90.51
20.57%
Operating Profit (PBDIT) excl Other Income
15.69
11.02
42.38%
Interest
1.99
2.44
-18.44%
Exceptional Items
0.00
0.00
Consolidate Net Profit
8.93
5.55
60.90%
Operating Profit Margin (Excl OI)
14.38%
12.18%
2.20%
Values in Rs Cr.
Direction Arrows
Net Sales

YoY Growth in quarter ended Jun 2026 is 20.57% vs 17.71% in Jun 2025

Direction Arrows
Consolidated Net Profit

YoY Growth in quarter ended Jun 2026 is 60.90% vs 187.56% in Jun 2025

Half Yearly Results Snapshot (Consolidated) - Sep'25stock-summary

Sep'25
Sep'24
Change(%)
Net Sales
188.97
163.54
15.55%
Operating Profit (PBDIT) excl Other Income
24.02
14.73
63.07%
Interest
4.53
4.42
2.49%
Exceptional Items
0.00
0.00
Consolidate Net Profit
13.98
5.53
152.80%
Operating Profit Margin (Excl OI)
12.71%
9.01%
3.70%
Values in Rs Cr.
Direction Arrows
Net Sales

Growth in half year ended Sep 2025 is 15.55% vs 10.69% in Sep 2024

Direction Arrows
Consolidated Net Profit

Growth in half year ended Sep 2025 is 152.80% vs 13.09% in Sep 2024

Nine Monthly Results Snapshot (Consolidated) - Dec'25stock-summary

Dec'25
Dec'24
Change(%)
Net Sales
286.45
250.03
14.57%
Operating Profit (PBDIT) excl Other Income
36.11
24.17
49.40%
Interest
6.69
7.16
-6.56%
Exceptional Items
0.00
0.00
Consolidate Net Profit
19.98
9.05
120.77%
Operating Profit Margin (Excl OI)
12.61%
9.67%
2.94%
Values in Rs Cr.
Direction Arrows
Net Sales

YoY Growth in nine months ended Dec 2025 is 14.57% vs 14.27% in Dec 2024

Direction Arrows
Consolidated Net Profit

YoY Growth in nine months ended Dec 2025 is 120.77% vs 95.04% in Dec 2024

Annual Results Snapshot (Consolidated) - Mar'26stock-summary

Mar'26
Mar'25
Change(%)
Net Sales
387.00
347.82
11.26%
Operating Profit (PBDIT) excl Other Income
48.00
35.57
34.95%
Interest
9.12
9.36
-2.56%
Exceptional Items
0.00
0.00
Consolidate Net Profit
26.32
17.12
53.74%
Operating Profit Margin (Excl OI)
12.40%
10.23%
2.17%
Values in Rs Cr.
Direction Arrows
Net Sales

YoY Growth in year ended Mar 2026 is 11.26% vs 20.59% in Mar 2025

Direction Arrows
Consolidated Net Profit

YoY Growth in year ended Mar 2026 is 53.74% vs 117.81% in Mar 2025

stock-summaryCompany CV
About Commercial Syn Bags Ltd stock-summary
stock-summary
Commercial Syn Bags Ltd
Micro Cap
Packaging
Commercial Syn Bags Limited was incorporated on 10 December, 1984 at Indore, Madhya Pradesh. The Company is carrying on the business of manufacturer, producers, processors, importers, exporters, buyers and sellers of FIBC, BOPP, Bulk Bags, Poly Tarpaulin, Woven Sacks/Bags, Pond Liners, Box Bags, PP/ HDPE Fabric, Liner, Mulch Film, Technical Textiles and Flexible Packaging etc. from its various Plants located at Pithampur, District Dhar, (M.P). The Company is working in 2 Segments i.e.
Company Coordinates stock-summary
Company Details
Commercial House, 3-4 Jaora Compound M Y H Road Indore Madhya Pradesh : 452001
stock-summary
Tel: 91-731-4279525/26
stock-summary
investors@comsyn.com
Registrar Details
Bigshare Services Pvt Ltd , E-2 , Ansa Industrial Estate, Saki Vihar Road, Saki Naka, Andheri (E), Mumbai