
Compare Concord Enviro with Similar Stocks
Dashboard
Weak Long Term Fundamental Strength with a -55.50% CAGR growth in Operating Profits over the last 5 years
- The company has been able to generate a Return on Equity (avg) of 3.21% signifying low profitability per unit of shareholders funds
The company has declared Negative results for the last 4 consecutive quarters
Falling Participation by Institutional Investors
Below par performance in long term as well as near term
Stock DNA
Other Utilities
INR 605 Cr (Micro Cap)
34.00
37
0.00%
0.18
3.21%
1.08
Total Returns (Price + Dividend) 
Concord Enviro for the last several years.
Risk Adjusted Returns v/s
Returns Beta

News
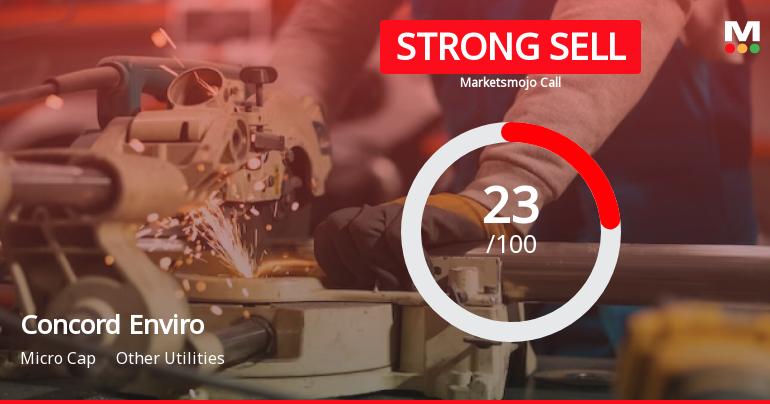
Concord Enviro Systems Ltd is Rated Strong Sell
Concord Enviro Systems Ltd is rated Strong Sell by MarketsMOJO, with this rating last updated on 01 Jul 2026. However, the analysis and financial metrics discussed here reflect the stock's current position as of 24 July 2026, providing investors with the latest insights into its performance and outlook.
Read full news article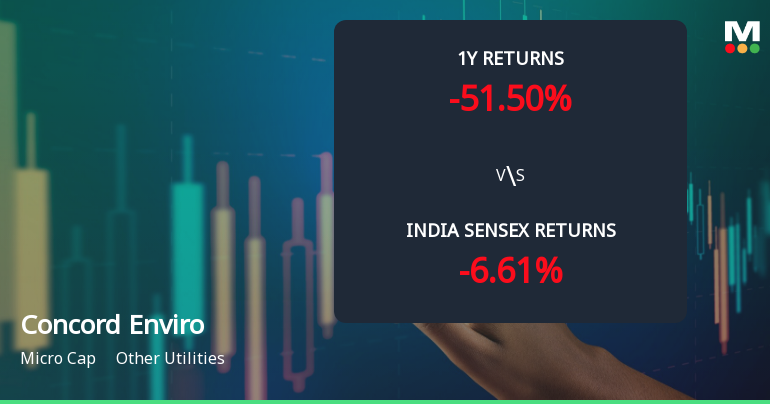
Concord Enviro Systems Ltd Faces Technical Downshift Amid Weak Price Momentum
Concord Enviro Systems Ltd, a micro-cap player in the Other Utilities sector, has experienced a notable shift in its technical parameters, signalling a mild bearish momentum after a period of sideways movement. The stock’s recent price action, combined with mixed technical indicator signals, paints a challenging picture for investors amid a broader market environment that has been relatively resilient.
Read full news article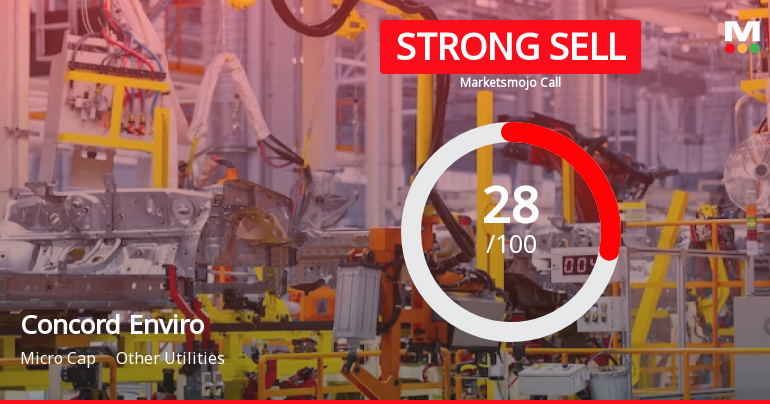
Concord Enviro Systems Ltd is Rated Strong Sell
Concord Enviro Systems Ltd is rated Strong Sell by MarketsMOJO, with this rating last updated on 01 July 2026. However, the analysis and financial metrics discussed here reflect the stock's current position as of 13 July 2026, providing investors with the latest insights into its performance and outlook.
Read full news article Announcements
Corporate Actions

No Upcoming Board Meetings

No Dividend history available

No Splits history available

No Bonus history available

No Rights history available
Quality key factors
Valuation key factors
Technicals key factors
 Technical Indicator Scale: Bearish, Mildly Bearish, Sideways, Mildly Bullish, Bullish Turned
 Shareholding Snapshot : Jun 2026
Shareholding Compare (%holding)
Promoters
None
Held by 2 Schemes (6.95%)
Held by 4 FIIs (0.37%)
Prayas Kamlesh Goel (23.9%)
Afholdings (14.13%)
21.74%
Quarterly Results Snapshot (Consolidated) - Mar'26 - QoQ

QoQ Growth in quarter ended Mar 2026 is 65.39% vs -0.22% in Dec 2025
QoQ Growth in quarter ended Mar 2026 is 273.11% vs -282.18% in Dec 2025
Half Yearly Results Snapshot (Consolidated) - Sep'25

Growth in half year ended Sep 2025 is -14.13% vs 52.54% in Sep 2024
Growth in half year ended Sep 2025 is -33.41% vs 348.65% in Sep 2024
Nine Monthly Results Snapshot (Consolidated) - Dec'25
YoY Growth in nine months ended Dec 2025 is -9.20% vs 30.61% in Dec 2024
YoY Growth in nine months ended Dec 2025 is -90.16% vs -67.34% in Dec 2024
Annual Results Snapshot (Consolidated) - Mar'26
YoY Growth in year ended Mar 2026 is -6.15% vs 19.64% in Mar 2025
YoY Growth in year ended Mar 2026 is -61.62% vs 24.25% in Mar 2025
About Concord Enviro Systems Ltd

Company Coordinates


