
Compare C C C L with Similar Stocks
Dashboard
With a Operating Losses, the company has a Weak Long Term Fundamental Strength
- Poor long term growth as Net Sales has grown by an annual rate of 4.88% and Operating profit at 7.97% over the last 5 years
- Low ability to service debt as the company has a high Debt to EBITDA ratio of -0.01 times
Risky - Negative EBITDA
Despite the size of the company, domestic mutual funds hold only 0% of the company
Stock DNA
Realty
INR 720 Cr (Micro Cap)
NA (Loss Making)
62
0.00%
-0.47
-3.70%
2.34
Total Returns (Price + Dividend) 
Latest dividend: 0.5 per share ex-dividend date: Jun-16-2011
Risk Adjusted Returns v/s
Returns Beta

News

Consolidated Construction Consortium Ltd is Rated Strong Sell
Consolidated Construction Consortium Ltd is rated Strong Sell by MarketsMOJO. This rating was last updated on 22 Dec 2025. However, the analysis and financial metrics discussed below reflect the stock’s current position as of 20 June 2026, providing investors with an up-to-date view of the company’s fundamentals, valuation, financial trend, and technical outlook.
Read full news article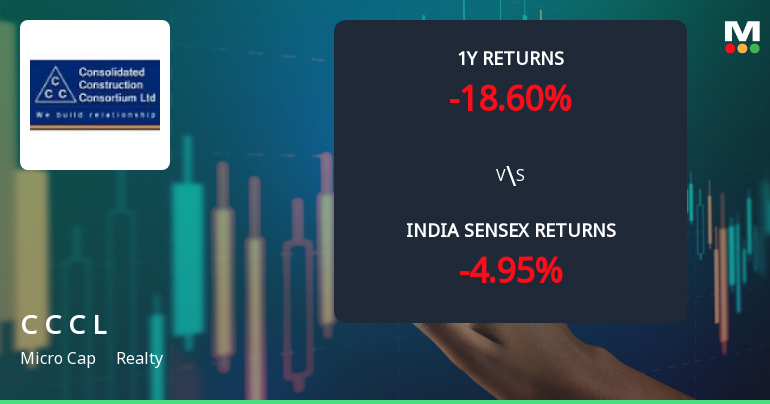
Consolidated Construction Consortium Ltd Faces Bearish Momentum Amid Technical Downgrade
Consolidated Construction Consortium Ltd (CCC Ltd), a micro-cap player in the realty sector, has experienced a notable shift in its technical momentum, with key indicators signalling a bearish outlook. The company’s MarketsMOJO grade has been downgraded from Sell to Strong Sell as of 22 December 2025, reflecting deteriorating technical and price action trends amid subdued market performance.
Read full news article
Consolidated Construction Consortium Ltd Technical Momentum Shifts Amid Mixed Market Signals
Consolidated Construction Consortium Ltd (CCC Ltd) has experienced a subtle shift in its technical momentum, moving from a bearish to a mildly bearish trend as of mid-June 2026. Despite a modest day gain of 1.58%, the stock remains under pressure with a MarketsMOJO Mojo Score of 29.0 and a Strong Sell grade, reflecting ongoing challenges in the realty sector and micro-cap volatility.
Read full news article Announcements
Announcement Under Regulation 30 (LODR) - Updates
15-Jun-2026 | Source : BSEAnnouncement under Regulation 30 (LODR) - updates
Announcement Under Regulation 30 (LODR) - Updates
20-May-2026 | Source : BSEAnnouncement under Regulation 30 (LODR) - updates - Enclosing Report on re-lodgement of physical transfer requests
Compliances-Reg.24(A)-Annual Secretarial Compliance
12-May-2026 | Source : BSEWe are enclosing the Annual Secretarial Compliance Report dated 11th May 2026 issued by Mr N Balachandran Company Secretary in Practice for the financial year ended 31st March 2026
Corporate Actions

No Upcoming Board Meetings

Consolidated Construction Consortium Ltd has declared 25% dividend, ex-date: 16 Jun 11

Consolidated Construction Consortium Ltd has announced 2:10 stock split, ex-date: 10 Feb 10

No Bonus history available

No Rights history available
Quality key factors
Valuation key factors
Technicals key factors
 Technical Indicator Scale: Bearish, Mildly Bearish, Sideways, Mildly Bullish, Bullish Turned
 Shareholding Snapshot : Mar 2026
Shareholding Compare (%holding)
Promoters
None
Held by 0 Schemes
Held by 2 FIIs (0.04%)
Sarabeswar. R . (31.59%)
Icici Bank Ltd (8.91%)
20.05%
Quarterly Results Snapshot (Consolidated) - Mar'26 - QoQ

QoQ Growth in quarter ended Mar 2026 is 39.20% vs 12.23% in Dec 2025

QoQ Growth in quarter ended Mar 2026 is -156.82% vs 918.60% in Dec 2025
Half Yearly Results Snapshot (Consolidated) - Sep'25
Growth in half year ended Sep 2025 is 38.33% vs 48.00% in Sep 2024
Growth in half year ended Sep 2025 is 78.14% vs 195.63% in Sep 2024
Nine Monthly Results Snapshot (Consolidated) - Dec'25
YoY Growth in nine months ended Dec 2025 is 39.77% vs 35.72% in Dec 2024
YoY Growth in nine months ended Dec 2025 is 155.45% vs 104.78% in Dec 2024
Annual Results Snapshot (Consolidated) - Mar'26
YoY Growth in year ended Mar 2026 is 61.94% vs 39.11% in Mar 2025
YoY Growth in year ended Mar 2026 is -9.84% vs -86.97% in Mar 2025
About Consolidated Construction Consortium Ltd

Company Coordinates


