
Compare Cons. Finvest with Similar Stocks
Stock DNA
Non Banking Financial Company (NBFC)
INR Cr (Micro Cap)
13.00
24
0.00%
0.00
0.00%
0.00
Total Returns (Price + Dividend) 

Risk Adjusted Returns v/s
Returns Beta
News

Consolidated Finvest & Holdings Ltd is Rated Strong Sell
Consolidated Finvest & Holdings Ltd is rated Strong Sell by MarketsMOJO. This rating was last updated on 14 February 2026, reflecting a shift from the previous 'Sell' grade. However, the analysis and financial metrics discussed here represent the stock's current position as of 09 June 2026, providing investors with an up-to-date view of the company’s fundamentals and market standing.
Read full news articleAre Consolidated Finvest & Holdings Ltd latest results good or bad?
The latest financial results for Consolidated Finvest & Holdings Ltd indicate a complex situation characterized by significant volatility in earnings and concerns regarding the sustainability of its profit margins. In the most recent quarter (Q2 FY26), the consolidated net profit experienced a substantial decline of 66.7% compared to the previous quarter, raising questions about the quality of earnings and the performance of its investment portfolio. This sharp drop contrasts with a notable increase in standalone net profit, which surged by 277.5% quarter-on-quarter, highlighting a disconnect between the consolidated and standalone performance metrics. The company's return on equity (ROE) stands at 12.13%, which is below average for investment holding companies, suggesting challenges in capital efficiency and management's ability to generate adequate returns from its investments. Additionally, the return o...
Read full news article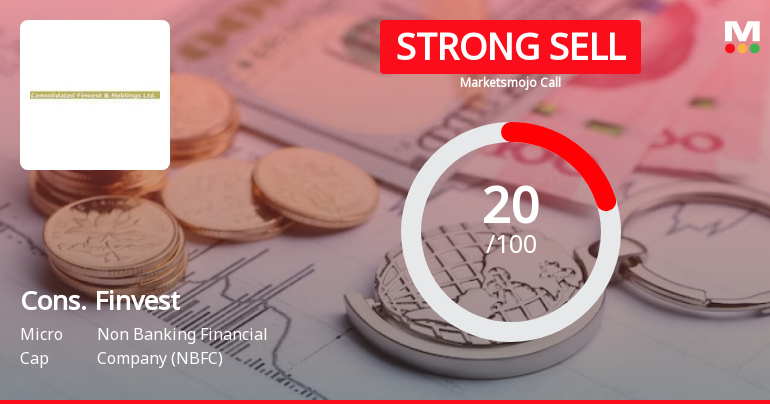
Consolidated Finvest & Holdings Ltd is Rated Strong Sell
Consolidated Finvest & Holdings Ltd is rated Strong Sell by MarketsMOJO. This rating was last updated on 14 Feb 2026. However, the analysis and financial metrics discussed here reflect the stock’s current position as of 26 May 2026, providing investors with the most recent and relevant data to assess the company’s outlook.
Read full news article Announcements
Consolidated Finvest & Holdings to discuss results
16-May-2023 | Source : BSEConsolidated Finvest & Holdings will hold a meeting of the Board of Directors of the Company on 22 May 2023.
Consolidated Finvest & Holdings schedules board meeting
07-Feb-2023 | Source : BSEConsolidated Finvest & Holdings will hold a meeting of the Board of Directors of the Company on 14 February 2023.
Consolidated Finvest & Holdings schedules board meeting
05-Nov-2022 | Source : BSEConsolidated Finvest & Holdings will hold a meeting of the Board of Directors of the Company on 14 November 2022.
Corporate Actions

No Upcoming Board Meetings

Consolidated Finvest & Holdings Ltd has declared 11% dividend, ex-date: 24 Jul 25

No Splits history available

No Bonus history available

No Rights history available
Quality key factors
Valuation key factors
Technicals key factors
 Technical Indicator Scale: Bearish, Mildly Bearish, Sideways, Mildly Bullish, Bullish Turned
 Shareholding Snapshot : Mar 2026
Shareholding Compare (%holding)
Promoters
None
Held by 2 Schemes (0.01%)
Held by 4 FIIs (2.58%)
Concatenate Advest Advisory Pvt Ltd (69.4%)
India Opportunities Growth Fund Ltd - Pinewood Strategy (2.58%)
13.61%
Quarterly Results Snapshot (Standalone) - Mar'26 - YoY

YoY Growth in quarter ended Mar 2026 is -29.30% vs 234.49% in Mar 2025
YoY Growth in quarter ended Mar 2026 is -39.95% vs 40.50% in Mar 2025
Half Yearly Results Snapshot (Standalone) - Sep'25
Growth in half year ended Sep 2025 is 6.40% vs 13.13% in Sep 2024
Growth in half year ended Sep 2025 is -59.54% vs 245.76% in Sep 2024
Nine Monthly Results Snapshot (Standalone) - Dec'25
YoY Growth in nine months ended Dec 2025 is 2.43% vs 8.02% in Dec 2024
YoY Growth in nine months ended Dec 2025 is -52.74% vs 183.05% in Dec 2024
Annual Results Snapshot (Standalone) - Mar'26
YoY Growth in year ended Mar 2026 is -7.40% vs 36.63% in Mar 2025
YoY Growth in year ended Mar 2026 is -50.03% vs 133.04% in Mar 2025
About Consolidated Finvest & Holdings Ltd

Company Coordinates


