
 Price Point
Compare Constronics with Similar Stocks
Mojo ParametersStock DNA

Trading & Distributors

INR 61 Cr (Micro Cap)

21.00
21

0.00%

-0.17

7.31%

1.60
Total ReturnsTotal Returns (Price + Dividend) 
Constronics for the last several years.
Risk Adjusted Returns v/s
Returns Beta
 News & Corporate Actions
News
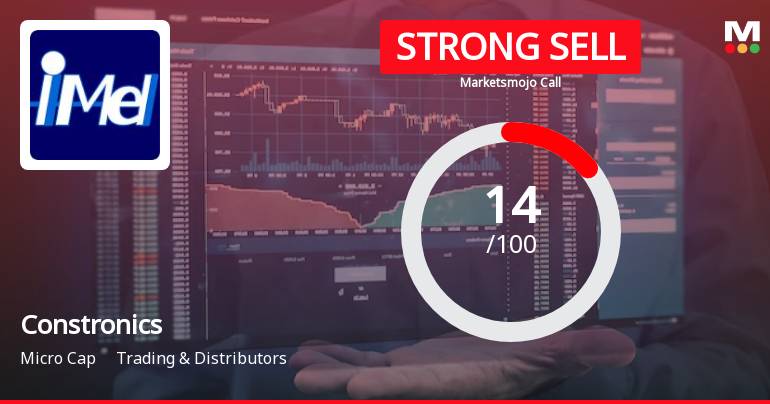
Constronics Infra Ltd is Rated Strong Sell
Constronics Infra Ltd is rated Strong Sell by MarketsMOJO, with this rating last updated on 14 February 2026. However, the analysis and financial metrics discussed here reflect the company’s current position as of 25 August 2026, providing investors with the latest insights into its performance and outlook.
Read full news article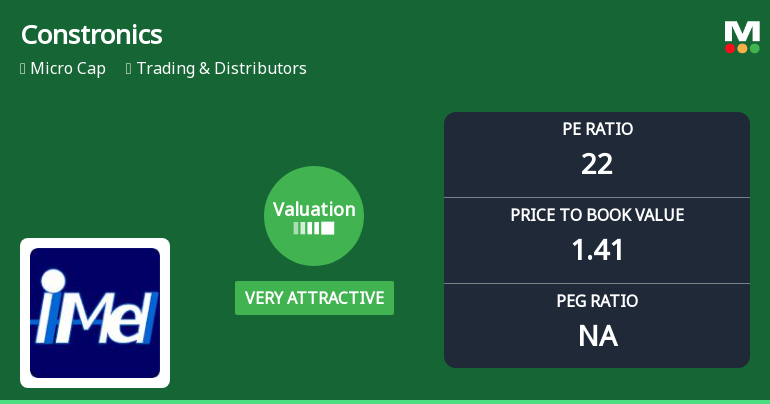
Constronics Infra Ltd Valuation Shifts to Very Attractive Amid Market Volatility
Constronics Infra Ltd, a micro-cap player in the Trading & Distributors sector, has witnessed a significant shift in its valuation parameters, moving from an attractive to a very attractive price level. Despite a sharp decline in share price and a downgrade in its overall Mojo Grade to Strong Sell, the company’s price-to-earnings (P/E) and price-to-book value (P/BV) ratios now present compelling valuation opportunities relative to its historical averages and peer group.
Read full news articleAre Constronics Infra Ltd latest results good or bad?
The latest financial results for Constronics Infra Ltd indicate a challenging operational environment. In Q4 FY26, the company reported a net profit of ₹0.17 crore, which reflects a significant year-on-year decline of 82.29%. Revenue for the same quarter was ₹7.15 crore, marking a 54.95% decrease compared to the previous year. This revenue figure is the lowest recorded in recent history, raising concerns about the sustainability of the company's business model. The operating margin for Q4 FY26 was notably low at 0.28%, the lowest on record, down from 6.87% in Q4 FY25. This decline in margins suggests increasing competitive pressures or challenges in pricing power within the company's core trading operations. Additionally, the return on equity (ROE) has decreased to 9.99%, down from an average of 20.02%, reflecting both profit declines and an expanded equity base due to capital raises. The operational metr...
Read full news article Announcements
Announcement under Regulation 30 (LODR)-Newspaper Publication
17-Aug-2026 | Source : BSENewspaper publication of the standalone and consolidated financial results for the quarter ended 30th June 2026
Financial Results For The Quarter Ended 30Th June 2026
14-Aug-2026 | Source : BSESubmission of the Un-Audited Standalone and Consolidated Financial Results for the quarter ended 30th June 2026
Board Meeting Outcome for Outcome Of The Board Meeting Held On 14Th August 2026
14-Aug-2026 | Source : BSEOutcome of the board meeting held on 14th August 2026 to approve the Un-Audited Standalone and Consolidated Financial Results for the quarter ended 30th June 2026
Corporate Actions

No Upcoming Board Meetings

No Dividend history available

No Splits history available

No Bonus history available

No Rights history available
Key FactorsQuality key factors
Valuation key factors
Technicals key factors
 Technical Indicator Scale: Bearish, Mildly Bearish, Sideways, Mildly Bullish, Bullish Turned Shareholding
Shareholding Snapshot : Jun 2026
Shareholding Compare (%holding)
Non Institution
99.9925
Held by 0 Schemes
Held by 0 FIIs
Vishnu Vardhan (10.63%)
Arulsundaram Nithya (12.33%)
72.01%
FinancialQuarterly Results Snapshot (Standalone) - Jun'26 - YoY
 Compare with Peers
YoY Growth in quarter ended Jun 2026 is -24.88% vs 345.45% in Jun 2025
YoY Growth in quarter ended Jun 2026 is -27.00% vs 1,766.67% in Jun 2025

Half Yearly Results Snapshot (Standalone) - Sep'25
Growth in half year ended Sep 2025 is 94.30% vs 8,240.00% in Sep 2024
Growth in half year ended Sep 2025 is 109.48% vs 3,766.67% in Sep 2024
Nine Monthly Results Snapshot (Standalone) - Dec'25
YoY Growth in nine months ended Dec 2025 is 27.37% vs 9,200.00% in Dec 2024
YoY Growth in nine months ended Dec 2025 is 34.91% vs 2,550.00% in Dec 2024
Annual Results Snapshot (Standalone) - Mar'26
YoY Growth in year ended Mar 2026 is -4.63% vs 6,519.48% in Mar 2025
YoY Growth in year ended Mar 2026 is -0.64% vs 334.72% in Mar 2025
 Company CV
About Constronics Infra Ltd

Company Coordinates










