
Compare Cont. Securities with Similar Stocks
Stock DNA
Non Banking Financial Company (NBFC)
INR 44 Cr (Micro Cap)
20.00
20
0.28%
0.01
8.40%
1.61
Total Returns (Price + Dividend) 
Latest dividend: 0.04 per share ex-dividend date: Sep-15-2025
Risk Adjusted Returns v/s
Returns Beta

News
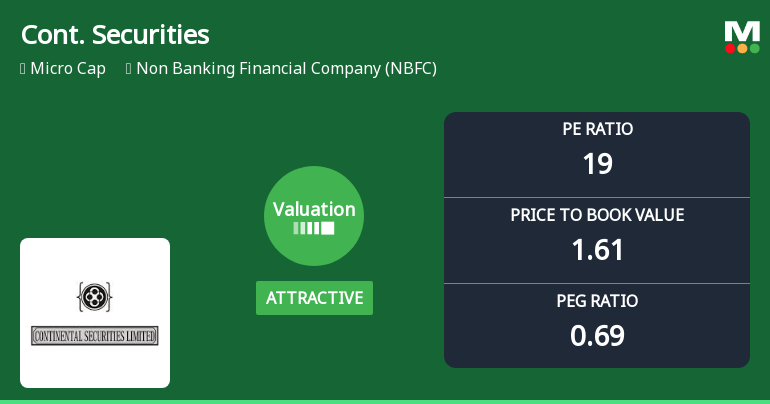
Continental Securities Ltd Valuation Shifts Signal Renewed Price Attractiveness
Continental Securities Ltd, a micro-cap player in the Non Banking Financial Company (NBFC) sector, has witnessed a notable shift in its valuation parameters, moving from a very attractive to an attractive rating. This change reflects evolving market perceptions and presents a nuanced picture of the stock’s price attractiveness relative to its historical and peer benchmarks.
Read full news article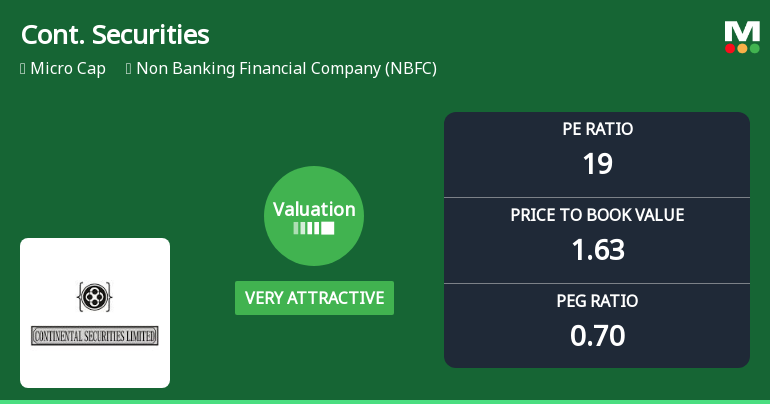
Continental Securities Ltd Valuation Shifts to Very Attractive Amid Mixed Returns
Continental Securities Ltd, a micro-cap player in the Non Banking Financial Company (NBFC) sector, has seen its valuation parameters improve significantly, shifting from attractive to very attractive. Despite a challenging market environment and mixed returns relative to the Sensex, the company’s price-to-earnings (P/E) and price-to-book value (P/BV) ratios now present a compelling case for investors seeking value in the NBFC space.
Read full news article
Continental Securities Ltd is Rated Strong Sell
Continental Securities Ltd is rated Strong Sell by MarketsMOJO. This rating was last updated on 11 May 2026, reflecting a reassessment of the stock’s outlook. However, all fundamentals, returns, and financial metrics discussed below are current as of 25 May 2026, providing investors with the latest view of the company’s position in the market.
Read full news article Announcements
Announcement under Regulation 30 (LODR)-Newspaper Publication
09-May-2026 | Source : BSECopies of newspaper clippings of Audited Financial Results for the quarter and financial year ended march 31 2026.
Appointment Of Internal Auditor
08-May-2026 | Source : BSEConsidered and approved Appointment of Internal Auditor.
Board Meeting Outcome for Outcome Of Board Meeting
08-May-2026 | Source : BSEConsidered and approved Audited Financial Results for quarter and financial year ended 31st March 2026.
Corporate Actions

No Upcoming Board Meetings

Continental Securities Ltd has declared 2% dividend, ex-date: 15 Sep 25

Continental Securities Ltd has announced 2:10 stock split, ex-date: 20 Mar 23

No Bonus history available

No Rights history available
Quality key factors
Valuation key factors
Technicals key factors
 Technical Indicator Scale: Bearish, Mildly Bearish, Sideways, Mildly Bullish, Bullish Turned
 Shareholding Snapshot : Mar 2026
Shareholding Compare (%holding)
Non Institution
None
Held by 0 Schemes
Held by 0 FIIs
Vachi Commercial Llp (8.7%)
Taarush Tradecom Llp (5.59%)
40.05%
Quarterly Results Snapshot (Standalone) - Mar'26 - YoY

YoY Growth in quarter ended Mar 2026 is 46.58% vs 69.77% in Mar 2025

YoY Growth in quarter ended Mar 2026 is 78.12% vs 60.00% in Mar 2025
Half Yearly Results Snapshot (Standalone) - Sep'25
Growth in half year ended Sep 2025 is 43.85% vs 71.05% in Sep 2024
Growth in half year ended Sep 2025 is 43.06% vs 105.71% in Sep 2024
Nine Monthly Results Snapshot (Standalone) - Dec'25
YoY Growth in nine months ended Dec 2025 is 43.28% vs 73.28% in Dec 2024
YoY Growth in nine months ended Dec 2025 is 40.00% vs 105.36% in Dec 2024
Annual Results Snapshot (Standalone) - Mar'26
YoY Growth in year ended Mar 2026 is 43.27% vs 74.05% in Mar 2025
YoY Growth in year ended Mar 2026 is 64.66% vs 75.00% in Mar 2025
About Continental Securities Ltd

Company Coordinates


