
Compare Cool Caps with Similar Stocks
Dashboard
Weak Long Term Fundamental Strength as the company has not declared results in the last 6 months
- Low ability to service debt as the company has a high Debt to EBITDA ratio of 23.61 times
- The company has been able to generate a Return on Capital Employed (avg) of 5.53% signifying low profitability per unit of total capital (equity and debt)
Flat results in Jun 23
Risky - Negative Operating Profits
Below par performance in long term as well as near term
Stock DNA
Diversified consumer products
INR 292 Cr (Micro Cap)
52.00
35
0.00%
1.68
10.70%
3.83
Total Returns (Price + Dividend) 
Cool Caps for the last several years.
Risk Adjusted Returns v/s
Returns Beta

News
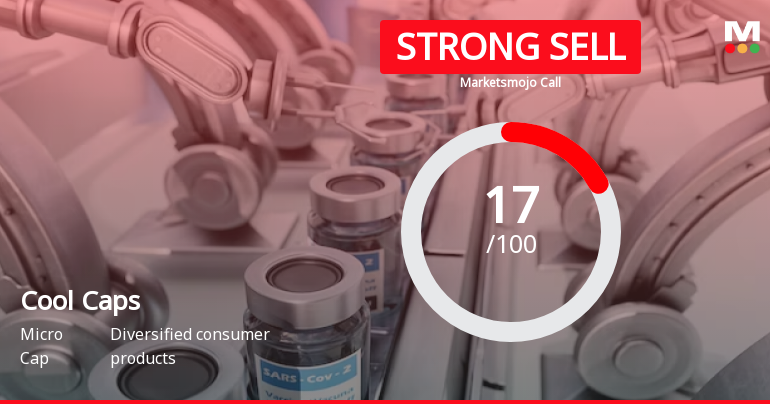
Cool Caps Industries Ltd is Rated Strong Sell
Cool Caps Industries Ltd is rated Strong Sell by MarketsMOJO. This rating was last updated on 08 December 2025. However, the analysis and financial metrics discussed below reflect the stock’s current position as of 11 June 2026, providing investors with the latest insights into the company’s performance and outlook.
Read full news article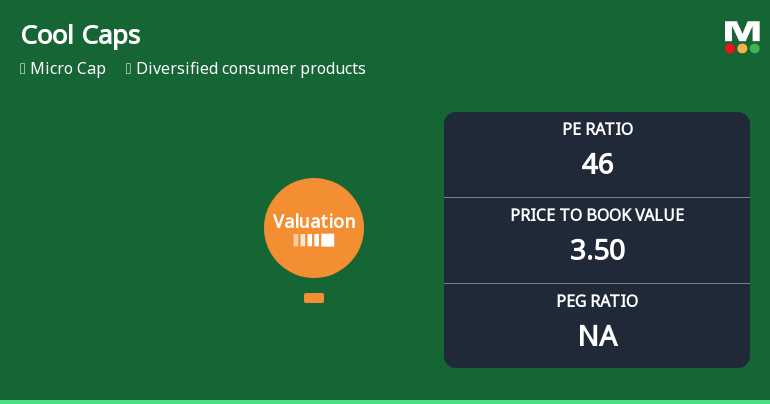
Cool Caps Industries Ltd Valuation Shifts Signal Elevated Risk Amid Price Attractiveness Decline
Cool Caps Industries Ltd, a micro-cap player in the diversified consumer products sector, has undergone a significant shift in its valuation profile, prompting a downgrade in its investment grade to Strong Sell. With its price-to-earnings (P/E) ratio and price-to-book value (P/BV) metrics now signalling elevated risk, investors are urged to reassess the stock’s attractiveness amid a backdrop of weak returns and challenging market conditions.
Read full news article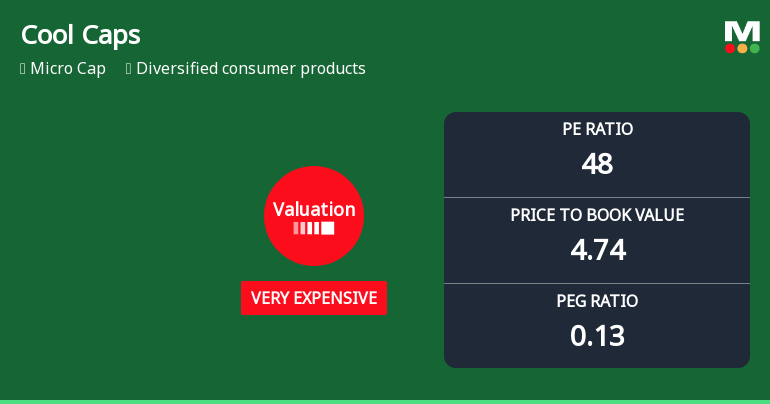
Cool Caps Industries Ltd Valuation Shifts Signal Heightened Price Risk
Cool Caps Industries Ltd, a micro-cap player in the diversified consumer products sector, has seen a marked deterioration in its valuation attractiveness, with key metrics such as the price-to-earnings (P/E) and price-to-book value (P/BV) ratios escalating to levels that now classify the stock as very expensive. This shift comes amid a steep decline in share price and deteriorating returns, raising concerns about the stock’s risk profile relative to its peers and historical benchmarks.
Read full news article Announcements
Corporate Actions

No Upcoming Board Meetings

No Dividend history available

Cool Caps Industries Ltd has announced 2:10 stock split, ex-date: 04 Jul 25

Cool Caps Industries Ltd has announced 1:1 bonus issue, ex-date: 04 Jul 25

Cool Caps Industries Ltd has announced 1:1 rights issue, ex-date: 23 Sep 25
Quality key factors
Valuation key factors
Technicals key factors
 Technical Indicator Scale: Bearish, Mildly Bearish, Sideways, Mildly Bullish, Bullish Turned
 Shareholding Snapshot : Mar 2026
Shareholding Compare (%holding)
Promoters
10.4461
Held by 0 Schemes
Held by 0 FIIs
Purv Flexipack Ltd (63.26%)
Holani Consultants Private Limited (1.69%)
25.81%
Quarterly Results Snapshot (Consolidated) - Jun'23 - QoQ

QoQ Growth in quarter ended Jun 2023 is -39.33% vs 0.22% in Mar 2023
QoQ Growth in quarter ended Jun 2023 is -14.00% vs 576.19% in Mar 2023
Half Yearly Results Snapshot (Consolidated) - Sep'25

Growth in half year ended Sep 2025 is 87.83% vs 47.91% in Mar 2025
Growth in half year ended Sep 2025 is -24.85% vs 35.17% in Mar 2025
Nine Monthly Results Snapshot (Consolidated) - Jun'23
YoY Growth in nine months ended Jun 2023 is 129.53% vs 12.50% in Jun 2023
YoY Growth in nine months ended Jun 2023 is 1.17% vs 23.59% in Jun 2023
Annual Results Snapshot (Consolidated) - Mar'25
YoY Growth in year ended Mar 2025 is 55.53% vs -15.58% in Mar 2024
YoY Growth in year ended Mar 2025 is 204.58% vs -31.17% in Mar 2024
About Cool Caps Industries Ltd

Company Coordinates


