
Compare Cords Cable with Similar Stocks
Stock DNA
Cables - Electricals
INR 262 Cr (Micro Cap)
13.00
47
0.48%
0.37
10.24%
1.33
Total Returns (Price + Dividend) 
Latest dividend: 1 per share ex-dividend date: Sep-22-2025
Risk Adjusted Returns v/s
Returns Beta

News

Cords Cable Industries Ltd is Rated Strong Buy
Cords Cable Industries Ltd is rated Strong Buy by MarketsMOJO, with this rating last updated on 29 May 2026. However, the analysis and financial metrics discussed here reflect the company’s current position as of 04 June 2026, providing investors with the latest insights into its performance and outlook.
Read full news article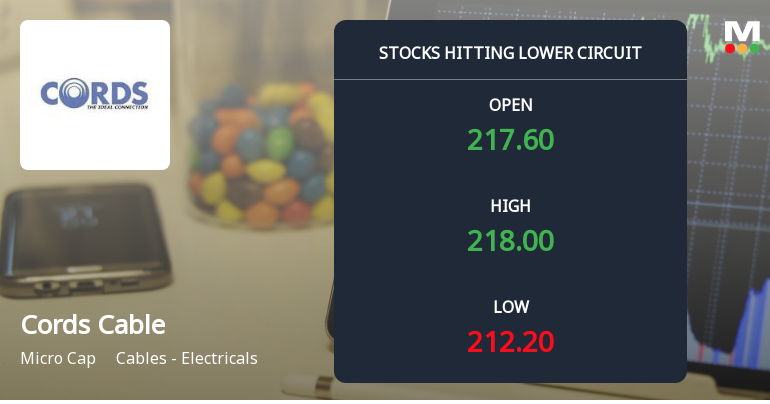
Cords Cable Industries Ltd Locks at Lower Circuit With 5% Loss — Sellers Queue, No Buyers in Sight
At Rs 211.9, sellers were still queuing — but there were no buyers willing to take the other side. Cords Cable Industries Ltd locked at its lower circuit of 5% on 3 Jun 2026, with unfilled sell orders and a frozen price, signalling persistent selling pressure in a micro-cap stock with limited liquidity.
Read full news article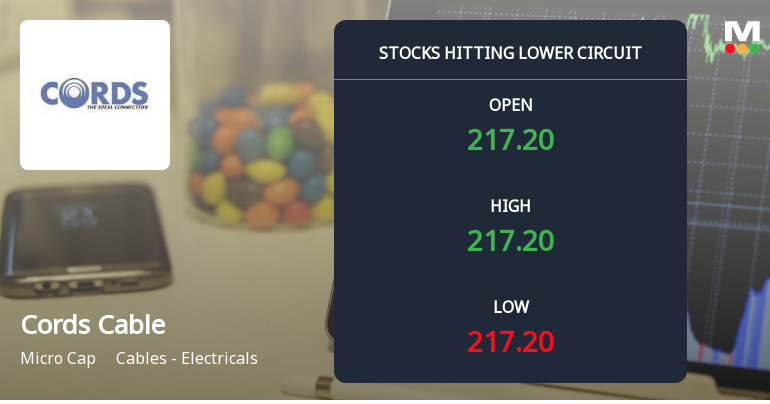
Cords Cable Industries Ltd Locks at Lower Circuit With 5.0% Loss — Sellers Queue, No Buyers in Sight
At Rs 216.52, sellers were still queuing — but there were no buyers willing to take the other side. Cords Cable Industries Ltd locked at its lower circuit of 5.0% on 2 Jun 2026, with unfilled sell orders and a frozen price.
Read full news article Announcements
Announcement under Regulation 30 (LODR)-Newspaper Publication
29-May-2026 | Source : BSEPursuant to Reg 30 of SEBI(LODR) Regulations2015 Please find enclosed herewith the copy of Audited Financial Results of the company for the 4th Quarter/Financial year ended on March 31 2026 as published in Financial express and Jansatta newspapers on May 29 2026.
Announcement under Regulation 30 (LODR)-Dividend Updates
28-May-2026 | Source : BSEThe Board of Directors in their meeting held on today i.e. May 28 2026 have recommended the final dividendof Rs. 1.20/-i.e. @ 12% per equity shares of face value of Rs. 10/- each fully paid up for the FY 25-26 subject to the approval of members at the ensuing AGM of the company.
Outcome Of Board Meeting
28-May-2026 | Source : BSEThis is to inform the exchanges that Board of Directors in their meeting held on today i.e. Thursday May 28 2026 at the registered office of the company inter alia considered and approved the Audited Standalone Financial Results along with Auditors Report and other agenda items.
Corporate Actions

No Upcoming Board Meetings

Cords Cable Industries Ltd has declared 10% dividend, ex-date: 22 Sep 25

No Splits history available

No Bonus history available

No Rights history available
Quality key factors
Valuation key factors
Technicals key factors
 Technical Indicator Scale: Bearish, Mildly Bearish, Sideways, Mildly Bullish, Bullish Turned
 Shareholding Snapshot : Mar 2026
Shareholding Compare (%holding)
Promoters
None
Held by 0 Schemes
Held by 3 FIIs (1.42%)
Naveen Sawhney (47.22%)
Acadian Emerging Markets Micro-cap Equity Master Fund (1.29%)
40.78%
Quarterly Results Snapshot (Standalone) - Mar'26 - YoY

YoY Growth in quarter ended Mar 2026 is 14.43% vs 30.14% in Mar 2025

YoY Growth in quarter ended Mar 2026 is 84.41% vs 39.01% in Mar 2025
Half Yearly Results Snapshot (Standalone) - Sep'25
Growth in half year ended Sep 2025 is 26.83% vs 26.84% in Sep 2024
Growth in half year ended Sep 2025 is 35.45% vs 41.39% in Sep 2024
Nine Monthly Results Snapshot (Standalone) - Dec'25
YoY Growth in nine months ended Dec 2025 is 22.39% vs 25.15% in Dec 2024
YoY Growth in nine months ended Dec 2025 is 21.51% vs 48.83% in Dec 2024
Annual Results Snapshot (Standalone) - Mar'26
YoY Growth in year ended Mar 2026 is 20.05% vs 26.57% in Mar 2025
YoY Growth in year ended Mar 2026 is 40.70% vs 45.68% in Mar 2025
About Cords Cable Industries Ltd

Company Coordinates


