
Compare Corona Remedies with Similar Stocks
Dashboard
High Management Efficiency with a high ROCE of 0%
The company is Net-Debt Free
Healthy long term growth as Operating profit has grown by an annual rate 0%
Flat results in Mar 26
With ROCE of 29.5, it has a Very Expensive valuation with a 12.4 Enterprise value to Capital Employed
Increasing Participation by Institutional Investors
Stock DNA
Pharmaceuticals & Biotechnology
INR 10,454 Cr (Small Cap)
53.00
34
0.00%
0.16
26.75%
13.77
Total Returns (Price + Dividend) 
Corona Remedies for the last several years.
Risk Adjusted Returns v/s
Returns Beta

News

Corona Remedies Ltd Technical Momentum Shifts Amid Sideways Trend
Corona Remedies Ltd has experienced a notable shift in its technical momentum, transitioning from a mildly bullish stance to a sideways trend, reflecting a period of consolidation after recent gains. Despite a day-on-day decline of 2.31%, the stock’s year-to-date return of 24.88% significantly outpaces the Sensex’s negative 13.19%, signalling underlying strength amid broader market weakness.
Read full news article
Corona Remedies Ltd Upgraded to Hold by MarketsMOJO on Technical and Valuation Improvements
Corona Remedies Ltd has seen its investment rating upgraded from Sell to Hold, reflecting a shift in technical indicators alongside steady financial performance and valuation metrics. The upgrade, effective from 09 June 2026, is driven primarily by a more favourable technical trend, balanced by flat quarterly results and a high valuation, positioning the stock as a cautious but watchful opportunity for investors.
Read full news article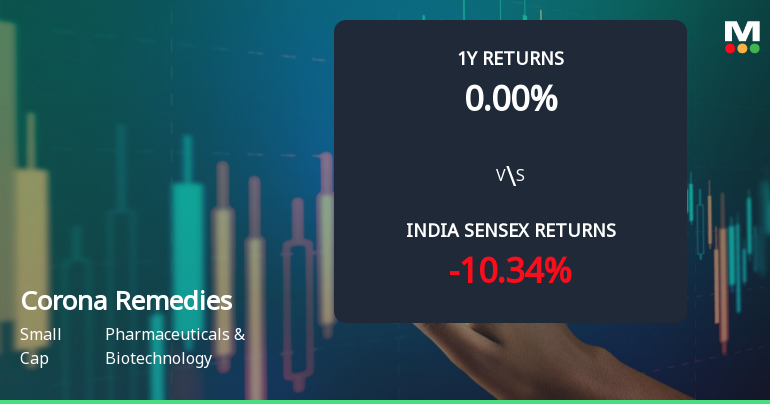
Corona Remedies Ltd Shows Renewed Momentum with Technical Upgrades and Strong Returns
Corona Remedies Ltd, a small-cap player in the Pharmaceuticals & Biotechnology sector, has exhibited a notable shift in its technical momentum, moving from a sideways trend to a mildly bullish stance. This change is underscored by a combination of technical indicators, including MACD, RSI, Bollinger Bands, and moving averages, signalling a potential positive trajectory for the stock amid broader market challenges.
Read full news article Announcements
Announcement under Regulation 30 (LODR)-Newspaper Publication
10-Jun-2026 | Source : BSENewspaper Publication - Intimation of 22nd Annual General Meeting of the Company through Video Conferencing / Other Audio Visual Means (VC / OAVM) facility
Announcement under Regulation 30 (LODR)-Analyst / Investor Meet - Intimation
10-Jun-2026 | Source : BSEIntimation for Schedule of Analysts / Investor Conference
Announcement under Regulation 30 (LODR)-Analyst / Investor Meet - Intimation
03-Jun-2026 | Source : BSEIntimation for Non-Deal Roadshow
Corporate Actions

No Upcoming Board Meetings

Corona Remedies Ltd has declared 100% dividend, ex-date: 19 Jun 26

No Splits history available

No Bonus history available

No Rights history available
Quality key factors
Valuation key factors
Technicals key factors
 Technical Indicator Scale: Bearish, Mildly Bearish, Sideways, Mildly Bullish, Bullish Turned
 Shareholding Snapshot : Mar 2026
Shareholding Compare (%holding)
Promoters
None
Held by 17 Schemes (6.35%)
Held by 21 FIIs (2.25%)
Ankurbhai K Mehta (22.0%)
Sepia Investments Limited (19.76%)
0.77%
Quarterly Results Snapshot (Standalone) - Mar'26 - QoQ

QoQ Growth in quarter ended Mar 2026 is 3.12% vs -5.18% in Dec 2025
QoQ Growth in quarter ended Mar 2026 is 9.21% vs -20.90% in Dec 2025
Half Yearly Results Snapshot (Standalone) - Sep'25
Not Applicable: The company has declared_date for only one period
Not Applicable: The company has declared_date for only one period
Nine Monthly Results Snapshot (Standalone) - Dec'25
Not Applicable: The company has declared_date for only one period
Not Applicable: The company has declared_date for only one period
Annual Results Snapshot (Standalone) - Mar'26
Not Applicable: The company has declared_date for only one period
Not Applicable: The company has declared_date for only one period
About Corona Remedies Ltd

Company Coordinates


