
Compare Craftsman Auto with Similar Stocks
Dashboard
Healthy long term growth as Net Sales has grown by an annual rate of 38.91% and Operating profit at 26.42%
With a growth in Operating Profit of 11.1%, the company declared Very Positive results in Mar 26
With ROCE of 11.8, it has a Fair valuation with a 4.1 Enterprise value to Capital Employed
High Institutional Holdings at 48.22%
Consistent Returns over the last 3 years
Stock DNA
Auto Components & Equipments
INR 24,116 Cr (Small Cap)
60.00
36
0.05%
1.06
12.06%
7.29
Total Returns (Price + Dividend) 
Latest dividend: 5 per share ex-dividend date: Jul-14-2025
Risk Adjusted Returns v/s
Returns Beta

News

Craftsman Automation Ltd Technical Momentum Shifts Amid Mixed Indicator Signals
Craftsman Automation Ltd, a small-cap player in the Auto Components & Equipments sector, has experienced a nuanced shift in its technical momentum, reflecting a complex interplay of bullish and bearish signals across key indicators. Despite a slight dip in the latest session, the stock’s year-to-date and longer-term returns significantly outperform the Sensex, underscoring its resilience amid sectoral and market fluctuations.
Read full news article
Craftsman Automation Ltd Upgraded to Strong Buy on Improved Valuation and Financials
Craftsman Automation Ltd has been upgraded from a Buy to a Strong Buy rating, reflecting significant improvements in valuation metrics, financial trends, quality scores, and technical indicators. This upgrade, announced on 3 July 2026, follows a comprehensive reassessment of the company’s fundamentals and market performance, positioning it favourably within the Auto Components & Equipments sector.
Read full news article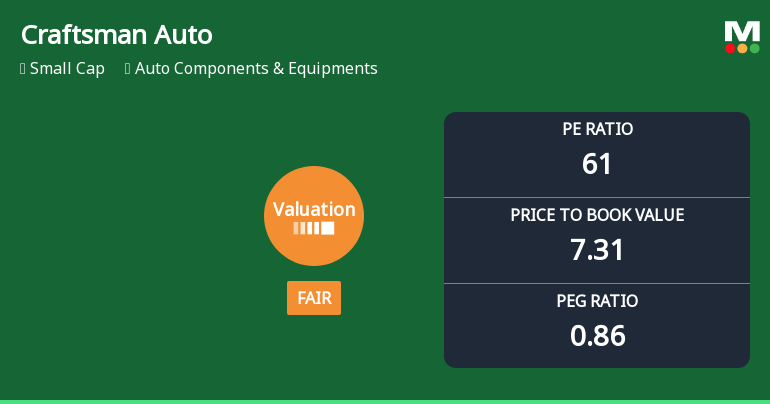
Craftsman Automation Ltd Valuation Shifts Signal Enhanced Price Attractiveness
Craftsman Automation Ltd has witnessed a notable shift in its valuation parameters, moving from an expensive to a fair valuation grade. This change, coupled with robust returns relative to the Sensex and a strong fundamental profile, positions the small-cap auto components player as an increasingly attractive investment opportunity in a competitive sector.
Read full news article Announcements
Corporate Actions

No Upcoming Board Meetings

Craftsman Automation Ltd has declared 225% dividend, ex-date: 16 Jul 26

No Splits history available

No Bonus history available

No Rights history available
Quality key factors
Valuation key factors
Technicals key factors
 Technical Indicator Scale: Bearish, Mildly Bearish, Sideways, Mildly Bullish, Bullish Turned
 Shareholding Snapshot : Jun 2026
Shareholding Compare (%holding)
Promoters
None
Held by 32 Schemes (22.55%)
Held by 185 FIIs (17.15%)
Mr. Srinivasan Ravi (40.15%)
Axis Mutual Fund Trustee Limited A/c Axis Mutual Fund A/c Axis Small Cap Fund (3.51%)
5.47%
Quarterly Results Snapshot (Consolidated) - Mar'26 - QoQ

QoQ Growth in quarter ended Mar 2026 is 8.22% vs 2.78% in Dec 2025

QoQ Growth in quarter ended Mar 2026 is 8.69% vs 17.88% in Dec 2025
Half Yearly Results Snapshot (Consolidated) - Sep'25
Growth in half year ended Sep 2025 is 60.06% vs 6.70% in Sep 2024
Growth in half year ended Sep 2025 is 39.68% vs -32.03% in Sep 2024
Nine Monthly Results Snapshot (Consolidated) - Dec'25
YoY Growth in nine months ended Dec 2025 is 48.25% vs 17.78% in Dec 2024
YoY Growth in nine months ended Dec 2025 is 109.35% vs -47.22% in Dec 2024
Annual Results Snapshot (Consolidated) - Mar'26
YoY Growth in year ended Mar 2026 is 41.80% vs 27.83% in Mar 2025
YoY Growth in year ended Mar 2026 is 97.35% vs -36.10% in Mar 2025
About Craftsman Automation Ltd

Company Coordinates


