
Compare Creative Eye with Similar Stocks
Stock DNA
Media & Entertainment
INR 13 Cr (Micro Cap)
NA (Loss Making)
21
0.00%
-0.10
-12.21%
0.88
Total Returns (Price + Dividend) 
Creative Eye for the last several years.
Risk Adjusted Returns v/s
Returns Beta

News
Are Creative Eye Ltd latest results good or bad?
Creative Eye Ltd's latest financial results for Q4 FY26 reflect significant operational challenges. The company reported net sales of ₹0.42 crores, representing a substantial decline of 65.00% compared to ₹1.20 crores in Q4 FY25. This sharp drop in revenue is alarming, particularly as the company experienced zero revenue in three out of four quarters during FY26, indicating a severe inability to secure consistent business. The net profit for the quarter was a loss of ₹0.14 crores, contrasting with a profit of ₹0.23 crores in the same quarter last year, marking a significant deterioration in profitability. The operating margin was reported at negative 47.62%, a stark decline from the positive margin of 25.00% achieved in Q4 FY25. This negative operating leverage highlights the company's unsustainable cost structure, where fixed costs, particularly employee expenses, are consuming a significant portion of mi...
Read full news article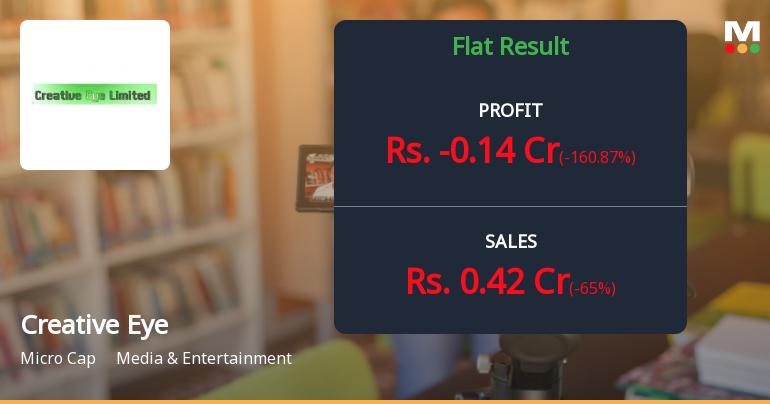
Creative Eye Ltd Q4 FY26: Losses Deepen Amid Revenue Collapse, Stock Remains Under Pressure
Creative Eye Limited reported a net loss of ₹0.14 crores for Q4 FY26, marking a deterioration from the ₹0.23 crores profit recorded in Q4 FY25. The Mumbai-based media and entertainment company, with a market capitalisation of ₹14.00 crores, continues to struggle with operational challenges as revenue plummeted 65.00% year-on-year to just ₹0.42 crores. The stock trades at ₹7.03, down 43.17% from its 52-week high of ₹12.37, reflecting persistent investor concerns about the company's ability to return to profitability.
Read full news articleAre Creative Eye Ltd latest results good or bad?
Creative Eye Ltd's latest financial results for Q3 FY26 reveal significant operational challenges. The company reported zero revenue for the third consecutive quarter, marking a complete cessation of business activities since Q1 FY26. This trend indicates a total operational shutdown, with no sales generated over the past nine months. The net loss for Q3 FY26 was ₹3.68 crores, which represents a substantial deterioration compared to the previous quarter's loss. The operating margin remains at 0.0%, reflecting the absence of any revenue-generating activities. Additionally, the return on equity has declined to negative 7.30%, highlighting ongoing value erosion for shareholders. The company's reliance on minimal other income does little to offset the operational losses, and interest expenses continue to burden the financials despite the company maintaining a debt-free balance sheet. In terms of cash flow, C...
Read full news article Announcements
Announcement under Regulation 30 (LODR)-Newspaper Publication
27-May-2026 | Source : BSENewspaper publication of Financial results for the quarter and year ended on 31st March 2026
Compliances-Reg.24(A)-Annual Secretarial Compliance
27-May-2026 | Source : BSEAnnual Secretarial Compliance Report for the Financial year 2025-26
Results For Financial Year As On 31St March 2026
26-May-2026 | Source : BSEApproval of quarterly and yearly financial results (Audited) as on 31st March 2026
Corporate Actions

No Upcoming Board Meetings

No Dividend history available

No Splits history available

No Bonus history available

No Rights history available
Quality key factors
Valuation key factors
Technicals key factors
 Technical Indicator Scale: Bearish, Mildly Bearish, Sideways, Mildly Bullish, Bullish Turned
 Shareholding Snapshot : Mar 2026
Shareholding Compare (%holding)
Promoters
None
Held by 0 Schemes
Held by 0 FIIs
Zuby Kochhar (35.6%)
Luxmi Kant Gupta (1.43%)
40.93%
Quarterly Results Snapshot (Standalone) - Mar'26 - YoY

YoY Growth in quarter ended Mar 2026 is -65.00% vs 650.00% in Mar 2025
YoY Growth in quarter ended Mar 2026 is -160.87% vs 142.59% in Mar 2025
Half Yearly Results Snapshot (Standalone) - Sep'25
Growth in half year ended Sep 2025 is -100.00% vs 354.84% in Sep 2024
Growth in half year ended Sep 2025 is -806.67% vs 89.29% in Sep 2024
Nine Monthly Results Snapshot (Standalone) - Dec'25
YoY Growth in nine months ended Dec 2025 is -100.00% vs 354.84% in Dec 2024
YoY Growth in nine months ended Dec 2025 is -430.53% vs 53.66% in Dec 2024
Annual Results Snapshot (Standalone) - Mar'26
YoY Growth in year ended Mar 2026 is -83.91% vs 455.32% in Mar 2025
YoY Growth in year ended Mar 2026 is -619.44% vs 72.20% in Mar 2025
About Creative Eye Ltd

Company Coordinates


