
Compare Creative Newtech with Similar Stocks
Dashboard
Healthy long term growth as Net Sales has grown by an annual rate of 39.05% and Operating profit at 50.19%
With a growth in Net Sales of 83.17%, the company declared Very Positive results in Mar 26
With ROCE of 13.3, it has a Attractive valuation with a 2 Enterprise value to Capital Employed
Stock DNA
Miscellaneous
INR 1,060 Cr (Micro Cap)
15.00
21
0.07%
0.83
19.33%
2.87
Total Returns (Price + Dividend) 
Latest dividend: 0.5 per share ex-dividend date: Sep-23-2025
Risk Adjusted Returns v/s
Returns Beta

News

Creative Newtech Ltd is Rated Buy by MarketsMOJO
Creative Newtech Ltd is rated Buy by MarketsMOJO, with this rating last updated on 08 June 2026. However, the analysis and financial metrics discussed here reflect the company’s current position as of 09 June 2026, providing investors with the most up-to-date view of its fundamentals, returns, and market standing.
Read full news article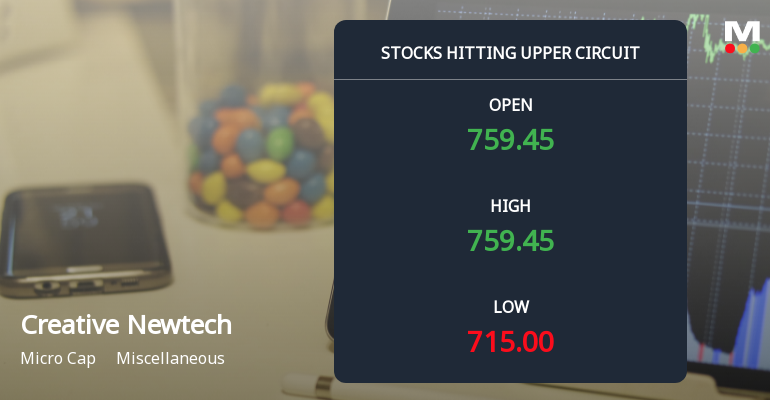
Creative Newtech Ltd Locks at Upper Circuit With 20% Gain — Buyers Queue, Sellers Absent
At Rs 756.75, the buying was done — not because demand dried up, but because the exchange wouldn't let the stock go any higher. Creative Newtech Ltd locked at its upper circuit of 20% on 08 Jun 2026, with buyers queuing and no sellers willing to part with shares.
Read full news article
Creative Newtech Ltd Technical Momentum Shifts Amid Market Volatility
Creative Newtech Ltd has experienced a notable shift in its technical momentum, moving from a mildly bearish stance to a sideways trend, reflecting a period of consolidation after recent price fluctuations. Despite a 2.14% gain on 2 June 2026, the stock’s technical indicators suggest a cautious outlook, with mixed signals from MACD, RSI, and moving averages, prompting a downgrade in its Mojo Grade from Buy to Hold.
Read full news article Announcements
Announcement under Regulation 30 (LODR)-Award_of_Order_Receipt_of_Order
06-Jun-2026 | Source : BSECreative Newtech Limited along with consortium partner received Advance Work Order (AWO) from BSNL for BharatNet Middle Mile Network Project in Odisha Teleocom Circle having a total project value of approximately INR 3194.83 Crores
Announcement under Regulation 30 (LODR)-Analyst / Investor Meet - Outcome
18-May-2026 | Source : BSETranscript of the Earnings/Analysts Call for Q4 FY26 Financial Results held on 15th May 2026
Newspaper Publication About Financial Results For Q4 FY26 Published In Active Times English Newspaper
16-May-2026 | Source : BSENewspaper Publication about Financial Results for Q4 FY26 published in Active Times English Newspaper
Corporate Actions

No Upcoming Board Meetings

Creative Newtech Ltd has declared 5% dividend, ex-date: 23 Sep 25

No Splits history available

Creative Newtech Ltd has announced 1:1 bonus issue, ex-date: 25 Jun 19

No Rights history available
Quality key factors
Valuation key factors
Technicals key factors
 Technical Indicator Scale: Bearish, Mildly Bearish, Sideways, Mildly Bullish, Bullish Turned
 Shareholding Snapshot : Mar 2026
Shareholding Compare (%holding)
Promoters
None
Held by 0 Schemes
Held by 5 FIIs (0.22%)
Ketan Chhaganlal Patel (56.2%)
Sapri Trading Dwc Llc (3.86%)
22.78%
Quarterly Results Snapshot (Consolidated) - Mar'26 - YoY

YoY Growth in quarter ended Mar 2026 is 83.17% vs 32.97% in Mar 2025
YoY Growth in quarter ended Mar 2026 is 29.57% vs -32.56% in Mar 2025
Half Yearly Results Snapshot (Consolidated) - Sep'25
Growth in half year ended Sep 2025 is 47.35% vs -20.68% in Sep 2024

Growth in half year ended Sep 2025 is 30.57% vs 36.54% in Sep 2024
Nine Monthly Results Snapshot (Consolidated) - Dec'25
YoY Growth in nine months ended Dec 2025 is 43.19% vs -2.66% in Dec 2024
YoY Growth in nine months ended Dec 2025 is 33.32% vs 41.20% in Dec 2024
Annual Results Snapshot (Consolidated) - Mar'26
YoY Growth in year ended Mar 2026 is 51.71% vs 4.07% in Mar 2025
YoY Growth in year ended Mar 2026 is 32.35% vs 10.07% in Mar 2025
About Creative Newtech Ltd

Company Coordinates


