
Compare Credo Brands with Similar Stocks
Dashboard
High Management Efficiency with a high ROCE of 17.54%
Strong ability to service debt as the company has a low Debt to EBITDA ratio of 1.44 times
Poor long term growth as Operating profit has grown by an annual rate -9.88% of over the last 5 years
Flat results in Mar 26
With ROCE of 18.5, it has a Very Attractive valuation with a 1.3 Enterprise value to Capital Employed
Increasing Participation by Institutional Investors
Underperformed the market in the last 1 year
Stock DNA
Garments & Apparels
INR 588 Cr (Micro Cap)
9.00
77
3.31%
0.47
16.67%
1.44
Total Returns (Price + Dividend) 
Latest dividend: 3.0000000000000004 per share ex-dividend date: Sep-10-2025
Risk Adjusted Returns v/s
Returns Beta

News
Credo Brands Marketing Ltd Upgraded to Hold on Technical and Valuation Improvements
Credo Brands Marketing Ltd, a micro-cap player in the Garments & Apparels sector, has seen its investment rating upgraded from Sell to Hold as of 23 June 2026. This change reflects a nuanced improvement across technical indicators, valuation metrics, financial trends, and overall quality assessments, signalling a cautious but more optimistic outlook for investors.
Read full news article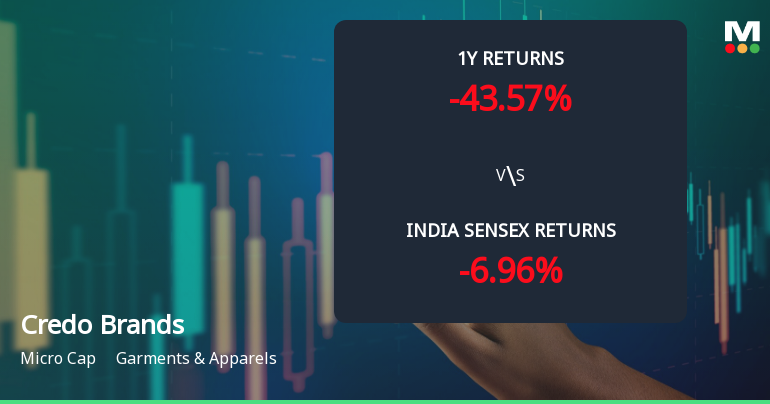
Credo Brands Marketing Ltd Technical Momentum Shifts to Sideways Amid Mixed Indicators
Credo Brands Marketing Ltd, a micro-cap player in the Garments & Apparels sector, has experienced a notable shift in its technical momentum, moving from a mildly bearish stance to a sideways trend. Despite a marginal day decline of 0.15%, the stock’s technical indicators reveal a complex interplay of bullish and bearish signals, prompting a reassessment of its near-term outlook.
Read full news article
Credo Brands Marketing Ltd is Rated Sell
Credo Brands Marketing Ltd is rated Sell by MarketsMOJO, with this rating last updated on 8 June 2026. While the rating change occurred on that date, the analysis and financial metrics discussed here reflect the stock’s current position as of 14 June 2026, providing investors with the most up-to-date view of the company’s fundamentals, returns, and market performance.
Read full news article Announcements
Corporate Actions

No Upcoming Board Meetings

Credo Brands Marketing Ltd has declared 150% dividend, ex-date: 10 Sep 25

No Splits history available

No Bonus history available

No Rights history available
Quality key factors
Valuation key factors
Technicals key factors
 Technical Indicator Scale: Bearish, Mildly Bearish, Sideways, Mildly Bullish, Bullish Turned
 Shareholding Snapshot : Mar 2026
Shareholding Compare (%holding)
Promoters
None
Held by 1 Schemes (0.95%)
Held by 6 FIIs (0.46%)
Kamal D Khushlani (28.01%)
Bennett, Coleman And Company Limited (8.24%)
28.55%
Quarterly Results Snapshot (Standalone) - Mar'26 - QoQ

QoQ Growth in quarter ended Mar 2026 is 11.07% vs -10.75% in Dec 2025
QoQ Growth in quarter ended Mar 2026 is 116.95% vs -62.80% in Dec 2025
Half Yearly Results Snapshot (Standalone) - Sep'25

Growth in half year ended Sep 2025 is -8.33% vs 8.92% in Sep 2024
Growth in half year ended Sep 2025 is -30.50% vs -0.88% in Sep 2024
Nine Monthly Results Snapshot (Standalone) - Dec'25
YoY Growth in nine months ended Dec 2025 is -7.57% vs 7.08% in Dec 2024
YoY Growth in nine months ended Dec 2025 is -41.00% vs 4.68% in Dec 2024
Annual Results Snapshot (Standalone) - Mar'26
YoY Growth in year ended Mar 2026 is -4.22% vs 8.96% in Mar 2025
YoY Growth in year ended Mar 2026 is -30.68% vs 15.64% in Mar 2025
About Credo Brands Marketing Ltd

Company Coordinates


