
Compare Crescentis Capit with Similar Stocks
Stock DNA
Non Banking Financial Company (NBFC)
INR 196 Cr (Micro Cap)
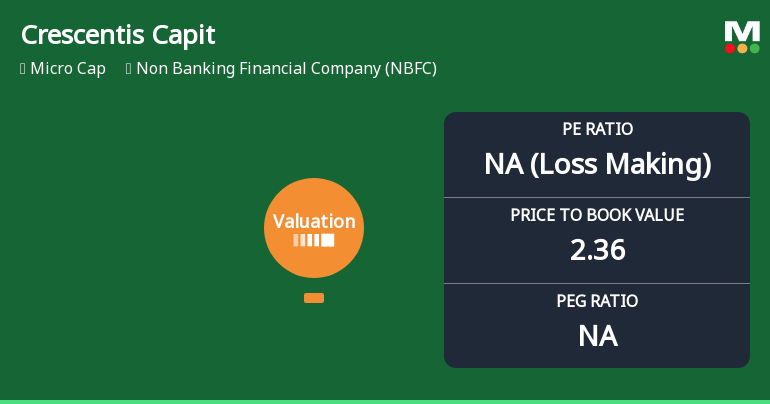
NA (Loss Making)
20
0.00%
0.00
-4.04%
2.40
Total Returns (Price + Dividend) 
Latest dividend: 1.0000 per share ex-dividend date: Sep-07-2011
Risk Adjusted Returns v/s
Returns Beta

News
Crescentis Capital Ltd Valuation Shifts Signal Elevated Risk for Investors
Crescentis Capital Ltd, a micro-cap player in the Non Banking Financial Company (NBFC) sector, has seen a marked deterioration in its valuation metrics, prompting a downgrade to a Strong Sell rating. The company’s price-to-earnings (P/E) and price-to-book value (P/BV) ratios have shifted into risky territory, reflecting growing investor concerns amid weak financial performance and negative returns relative to benchmarks.
Read full news articleAre Crescentis Capital Ltd latest results good or bad?
Crescentis Capital Ltd's latest quarterly results for March 2026 reveal significant operational challenges within its investment-driven business model. The company reported net sales of -₹7.44 crores, a stark reversal from the positive ₹3.72 crores in the previous quarter, indicating a dramatic sequential decline of 300.00%. This sharp downturn suggests substantial volatility in revenue generation, likely exacerbated by adverse market conditions impacting its investment portfolio. The profit after tax margin collapsed to 98.79%, while the operating profit before depreciation, interest, and tax (PBDIT) fell to negative ₹8.73 crores, marking a notable deterioration in financial performance. The net loss for the quarter was ₹7.35 crores, reflecting a 94.49% decline year-on-year, further highlighting the company's struggle to maintain profitability. Crescentis Capital's return on equity (ROE) has also seen a ...
Read full news article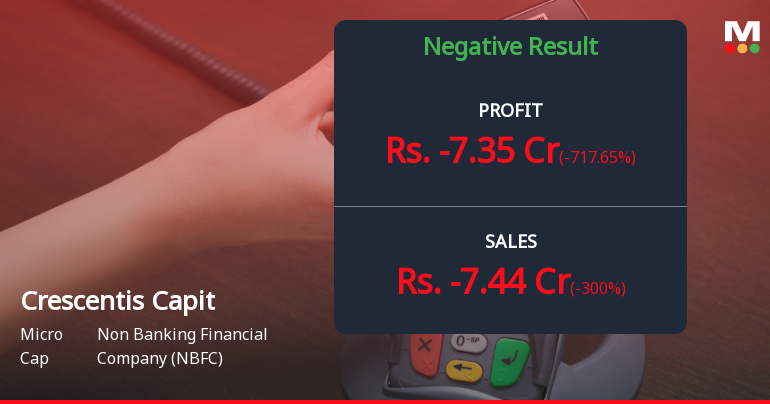
Crescentis Capital Q4 FY26: Steep Losses Raise Serious Concerns About Investment Model
Crescentis Capital Ltd., a micro-cap non-banking financial company focused on proprietary investments in stocks and securities, reported deeply troubling results for Q4 FY26, posting a net loss of ₹7.35 crores compared to a loss of ₹3.78 crores in the same quarter last year. The company's market capitalisation stands at ₹202.00 crores, with shares trading at ₹121.30 as of May 29, 2026, showing marginal gains of 0.25% in the immediate aftermath of the results announcement.
Read full news article Announcements
Unmodified Opinon
30-May-2026 | Source : BSEsubmission of Declaraion pursuant to Regulation 33(3)(d)
Announcement under Regulation 30 (LODR)-Newspaper Publication
30-May-2026 | Source : BSENewspaper Publication of Quarterly & Yearly Financial Results as on 31st March 2026
Announcement under Regulation 30 (LODR)-Meeting Updates
29-May-2026 | Source : BSERe-appointment of Mr. Subba Rao Veera Venkata Meka as the Managing Director and Mr. Bhavanam Ruthvik Reddy as Whole Time Director & CEO for a period of Five Years w.e.f 12-09-2026 subject to approval of Shareholders
Corporate Actions

No Upcoming Board Meetings

Crescentis Capital Ltd has declared 10% dividend, ex-date: 07 Sep 11

No Splits history available

No Bonus history available

Crescentis Capital Ltd has announced 7:10 rights issue, ex-date: 06 Jun 25
Quality key factors
Valuation key factors
Technicals key factors
 Technical Indicator Scale: Bearish, Mildly Bearish, Sideways, Mildly Bullish, Bullish Turned
 Shareholding Snapshot : Mar 2026
Shareholding Compare (%holding)
Promoters
None
Held by 0 Schemes
Held by 0 FIIs
Dr. Bhaskara Rao Bollineni (68.8%)
Soptex Developements Limited (1.45%)
20.11%
Quarterly Results Snapshot (Standalone) - Mar'26 - QoQ

QoQ Growth in quarter ended Mar 2026 is -300.00% vs 1,330.77% in Dec 2025
QoQ Growth in quarter ended Mar 2026 is -717.65% vs 347.92% in Dec 2025
Half Yearly Results Snapshot (Standalone) - Sep'25

Growth in half year ended Sep 2025 is 4.83% vs -28.08% in Sep 2024
Growth in half year ended Sep 2025 is 8.71% vs -54.56% in Sep 2024
Nine Monthly Results Snapshot (Standalone) - Dec'25
YoY Growth in nine months ended Dec 2025 is 1,175.71% vs -93.86% in Dec 2024
YoY Growth in nine months ended Dec 2025 is 346.06% vs -117.61% in Dec 2024
Annual Results Snapshot (Standalone) - Mar'26
YoY Growth in year ended Mar 2026 is 149.01% vs -120.09% in Mar 2025
YoY Growth in year ended Mar 2026 is 53.32% vs -144.79% in Mar 2025
About Crescentis Capital Ltd

Company Coordinates


